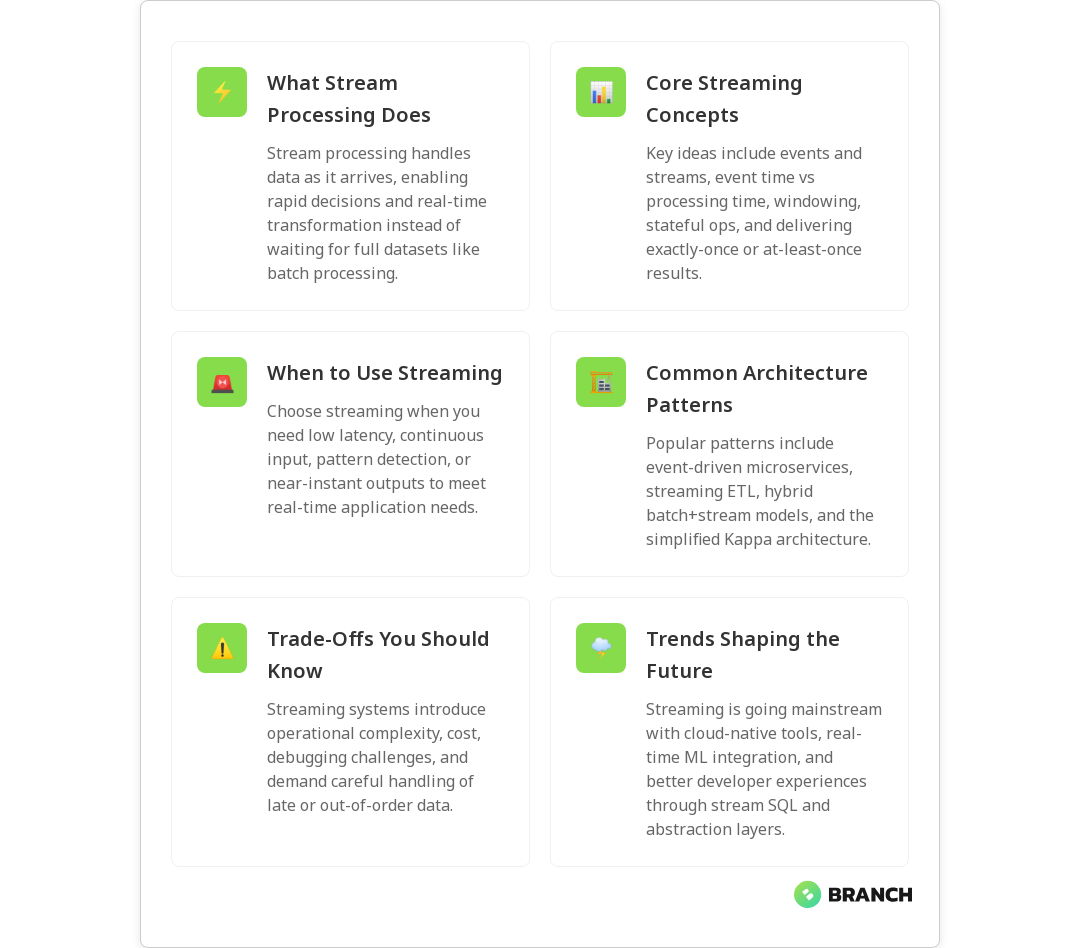
apache-image-blog

Apache Beam vs Kafka Streams: Which Stream Processing Framework to Choose

Stream processing is no longer a niche topic for big data teams — it’s a core capability for businesses that want real-time analytics, responsive user experiences, and faster decision-making. If you’re evaluating Apache Beam and Kafka Streams, you’re asking the right question: both are powerful, but they solve overlapping yet distinct problems. In this article you’ll learn how each framework works, where they shine, the operational trade-offs, and practical guidance to help you pick the best fit for your project.

Why this decision matters

Choosing the right stream processing framework influences developer productivity, operational complexity, cost, and system behavior under failure. The wrong choice can mean expensive rework or architecture constraints that slow growth. We’ll break down the technical and business trade-offs so you can pick a framework that supports your product roadmap — not one that forces you to bend your requirements to its limitations.

High-level comparison: models and philosophies

At a glance, the two projects take different approaches:

  • Apache Beam is a unified programming model for both batch and streaming that runs on multiple execution engines (called runners) such as Flink, Spark, and Google Cloud Dataflow. It’s about portability and consistency across execution environments — write once, run anywhere (within supported runners) — which can be a huge win for teams anticipating changing infrastructure or cloud providers. See the Apache Beam overview for more background.
  • Kafka Streams is a lightweight library specifically designed to process streams from Apache Kafka. It embeds processing in your application and optimizes for Kafka-native patterns — local state per instance, tight integration with Kafka’s consumer/producer model, and the kind of per-record latency modern applications need.

This difference — portability vs Kafka-native simplicity — is the axis that usually decides the choice.

Core technical differences

Programming model and portability

Apache Beam gives you a higher-level abstraction (PTransforms, windows, watermarks) that maps onto different runners. That means one Beam pipeline can be executed on Flink, Spark, or Dataflow without rewriting business logic, making Beam a great choice for teams that value portability or that work across clouds. The Confluent primer on Beam explains the unified model and runner flexibility in practical terms.

Kafka Streams, by contrast, is a library you embed in JVM applications. It’s not portable in the Beam sense — it’s intentionally tied to Kafka and the JVM ecosystem, but that tight coupling brings simplicity and performance advantages for Kafka-centric stacks.

State management and fault tolerance

Both frameworks support stateful processing and fault tolerance, but they approach it differently. Kafka Streams stores state locally with changelog topics in Kafka for durability and automatic recovery. It’s a pragmatic, operationally straightforward approach for Kafka-based deployments.

Beam delegates execution to runners which provide state, checkpointing, and exactly-once guarantees depending on the chosen runner. If you pick Flink as the runner, you get Flink’s advanced state backends and checkpointing behavior. This gives Beam flexibility but also means you’re responsible for understanding the guarantees and operational model of the runner you choose.

Latency, throughput, and performance

If your priority is sub-second per-record processing with minimal overhead, Kafka Streams is often the better fit. Kafka Streams is optimized for Kafka-native use cases and excels at low-latency, lightweight stateful operations — think real-time transforms, aggregations, and enrichment with local state. One comparison of stream engines highlights Kafka Streams’ per-record latency strengths.

Beam’s performance depends on the runner; some runners (e.g., Flink) are competitive for low-latency workloads, while others may be better suited to high-throughput or batch-heavy pipelines. If raw latency is critical, measure with your expected workload and chosen runner — performance characteristics can vary significantly between environments.

💡 Tip: Don’t choose based on hype alone. Benchmark small representative workloads (including state size and windowing behavior) with your expected traffic — both framework and runner choices can change results dramatically.

Operational and developer experience

Both frameworks require operational competence, but their operational profiles differ.

  • Kafka Streams: You operate Kafka and your application instances. Scaling is conventional — run more instances. Local state makes operations simple in many Kafka environments, and deployment integrates well with containerized or VM-based app infrastructure.
  • Apache Beam: You also operate the chosen runner (Flink/Spark/Dataflow). This can mean more moving parts but also allows separation of concerns: Beam for logic, the runner for execution. If you’re using cloud managed runners (e.g., Dataflow), you offload some operational burden at a cost.

Ease of operations often comes down to the team’s skill set and infrastructure preferences. If your team already runs Kafka and JVM services comfortably, Kafka Streams may be the path of least resistance. If you’re standardizing on an execution engine or expect to run processes on multiple backends, Beam’s portability can reduce long-term complexity.

Read more: Data Engineering for AI – useful if your stream pipelines are a foundation for AI features and need robust, production-ready data flows.

Use cases: when to pick each

Pick Kafka Streams when:

  • Your architecture is Kafka-centric and you want simplicity and low-latency per-record processing.
  • You prefer embedding processing logic directly in services rather than managing a separate stream processing cluster.
  • Your language and ecosystem are JVM friendly (Java, Scala, Kotlin).
  • You need lightweight stateful operations that rely on Kafka for durability.

Pick Apache Beam when:

  • You need a unified model for both batch and streaming workloads and want to run pipelines on different runners over time.
  • You anticipate changing execution environments or cloud providers and want portability.
  • Your team values a higher-level abstraction for complex event-time and windowing semantics.
  • You want to leverage runner-specific strengths (e.g., Flink’s stream processing features or Dataflow’s managed operations).
Read more: Tailored AI Solutions – explore how pipeline choices affect AI system design and why custom solutions often beat one-size-fits-all approaches.

Common challenges and trade-offs

No framework is perfect. Here are common trade-offs to weigh:

  • Complexity vs control: Beam offers more abstraction and portability but can introduce complexity when debugging or tuning across different runners. Kafka Streams is simpler but less portable.
  • Operational burden: Running Beam on an unmanaged Flink cluster means extra ops work; managed runners reduce that but add cost and potential vendor lock-in.
  • Language support: Kafka Streams is JVM-based; Beam has SDKs in Java, Python, and other languages depending on runner support. If your team uses Python heavily, Beam may be more attractive.
  • Performance nuances: Throughput and latency depend heavily on topology, state size, and runner configurations — don’t assume one framework will always outperform the other. Compare real-world tests like this streaming comparison to validate expectations.
Read more: Data Engineering Services – if you want help designing, building, and testing streaming pipelines with the right framework and operational model for your business.

Trends and ecosystem considerations

Stream processing ecosystems continue evolving. The move toward serverless and managed services for streaming (like managed runners) reduces operational complexity. At the same time, Kafka itself is broadening its ecosystem, and hybrid approaches (using Kafka for ingestion and Beam or Flink for heavy processing) are common.

Community support, active development, and integration with cloud-native tooling are practical factors. Articles comparing engines note that Beam’s ability to target different runners is a strategic advantage for multi-cloud architectures, while Kafka Streams remains compelling for single-provider Kafka-first stacks.

Read more: Cloud Infrastructure Services – helpful for teams deciding whether to run managed runners or host their own streaming clusters.

Decision checklist: quick questions to guide your choice

  1. Is Kafka already the backbone of your data platform? If yes, Kafka Streams is a natural fit.
  2. Do you need portability across execution engines or clouds? If yes, lean toward Apache Beam.
  3. Is low per-record latency and JVM-native integration critical? Kafka Streams likely wins.
  4. Does your team prefer higher-level abstractions for event-time semantics and complex windowing? Beam provides these features.
  5. What operational resources and expertise do you have? Managed runners vs self-hosted apps is an important operational trade-off.

Practical migration tip

If you need both portability and Kafka-native performance, consider a hybrid strategy: use Kafka Streams for the low-latency front line and Beam for heavier, multi-runner analytics pipelines. This lets you optimize for latency where it matters and maintain flexible, portable analytic pipelines for reporting and batch workloads.
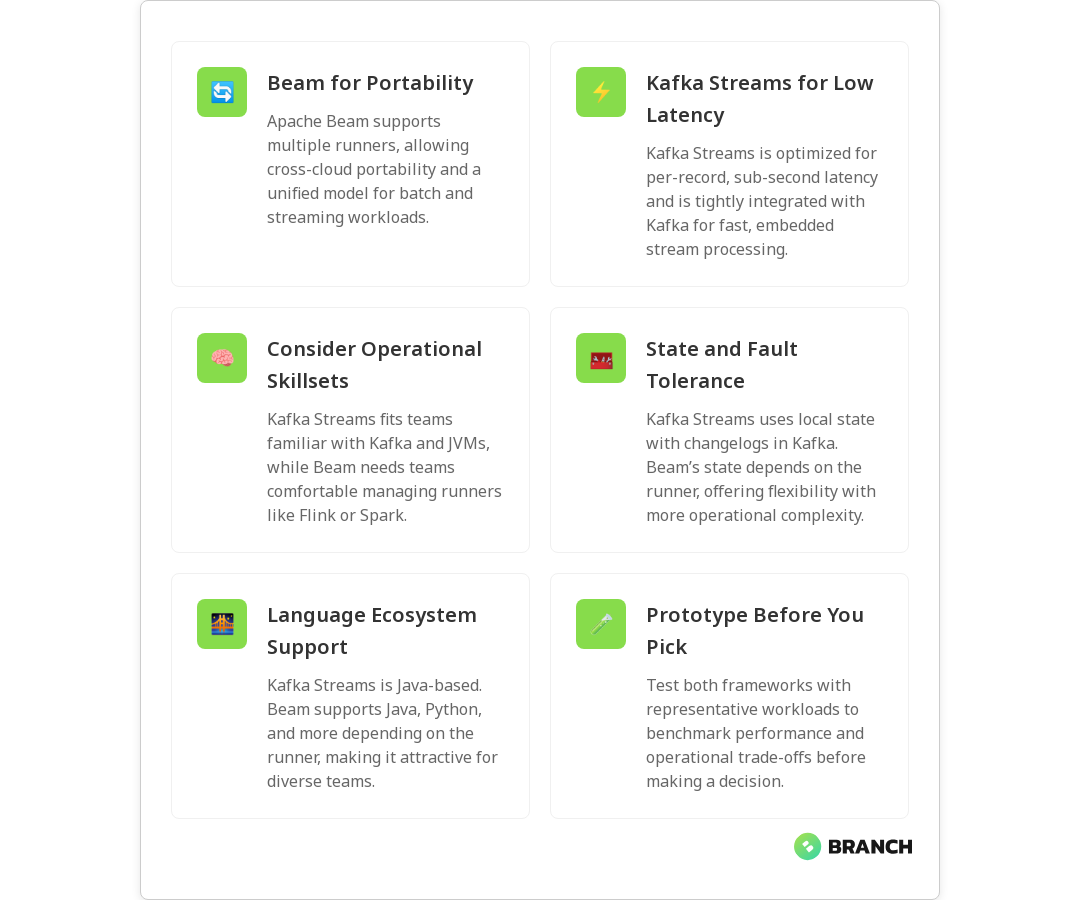
💡 Tip: Prototype both approaches with a narrow, representative workload. Measure latency, throughput, state size, and operational overhead. These metrics tell a clearer story than theoretical comparisons.

FAQ

What do you mean by stream processing?

Stream processing is the continuous, real-time handling of data as it flows through a system. Instead of processing data in scheduled batches, stream processing reacts to each event (or small groups of events) immediately, enabling live analytics, alerts, and real-time transformations.

Why is stream processing important?

Stream processing enables businesses to act on data instantly — think fraud detection, personalization, live metrics, or operational monitoring. It reduces time-to-insight, improves user experiences, and enables new product capabilities that aren’t possible with batch-only processing.

How is stream processing different from traditional data processing?

Traditional (batch) processing collects data over a window of time and processes it in bulk. Stream processing processes events continuously as they arrive, often with stricter latency and state consistency requirements. Stream processing also emphasizes event-time semantics (handling late or out-of-order events) and windowing.

What is a stream processing framework?

A stream processing framework is software that provides the abstractions and runtime for processing continuous data streams. It handles details like event-time processing, windows, state management, fault tolerance, and scaling so developers can focus on business logic. Examples include Apache Beam (with runners), Kafka Streams, Flink, and Spark Structured Streaming.

What are the capabilities of stream processing?

Common capabilities include event-time windowing, stateful processing, exactly-once or at-least-once delivery semantics, fault tolerance, scalability, and integrations with messaging systems and storage. Different frameworks emphasize different capabilities — for example, Beam prioritizes portability and unified batch/stream APIs, while Kafka Streams prioritizes Kafka-native low-latency processing.

Final thoughts

There’s no universally “right” answer between Apache Beam and Kafka Streams. If your world revolves around Kafka and you need low-latency, JVM-native processing with straightforward operations, Kafka Streams will likely get you the fastest path to production. If you value portability, want a unified batch-and-stream API, or need to target multiple execution backends, Apache Beam is the better long-term bet. The smart move is to prototype, measure, and align the choice with your team’s skills and your business goals.

If you’d like help evaluating, building, or operating your streaming pipeline, we design tailored solutions that balance engineering trade-offs with business outcomes — and we promise to explain our choices without too much jargon (or too many metaphors involving rivers and pipelines).

Read more: AI Development Services – useful when your streaming pipelines feed AI models or real-time inference workloads and you need end-to-end solutions.

For additional technical comparisons and practical overviews referenced in this article, see the Confluent Apache Beam introduction, a comparative guide of stream processing frameworks, and recent engine comparisons that examine latency and throughput trade-offs.

Useful external references: Apache Beam overview, stream processing framework guide, engine comparison, and detailed Kafka vs Beam comparison.

dataopsmatter-image-blog

What DataOps Really Is (and How It Transforms Data Team Productivity)

DataOps sounds a little like a trendy gym for data pipelines — and in a way it is: disciplined, repeatable, and focused on measurable improvement. But it’s more than a buzzword. DataOps brings engineering rigor, automation, and cross-team collaboration to the messy world of data so businesses can deliver reliable insights faster. In this article you’ll learn what DataOps actually means, the core principles and components that make it work, practical ways it increases productivity, and a roadmap to get started without tearing down the house.

Why DataOps matters right now

Companies are drowning in data but starving for trustworthy insights. Traditional data projects can be slow, error-prone, and siloed: engineers build pipelines, analysts complain about data quality, and stakeholders wait months for reports that are already stale. DataOps addresses those frictions by applying software engineering practices — automation, CI/CD, testing, and collaboration — to the data lifecycle. The result is faster delivery of analytics, fewer surprises, and teams that can iterate on data products with confidence.

For an overview of how organizations are defining and adopting DataOps, see this practical primer from IBM on applying automation and collaborative workflows across data teams.

💡 Tip: Start small: apply DataOps principles to one high-value pipeline before scaling. Quick wins build trust and demonstrate measurable productivity gains.
Read more: Data Engineering for AI – a clear explanation of why sturdy data pipelines are essential for advanced analytics and AI projects.

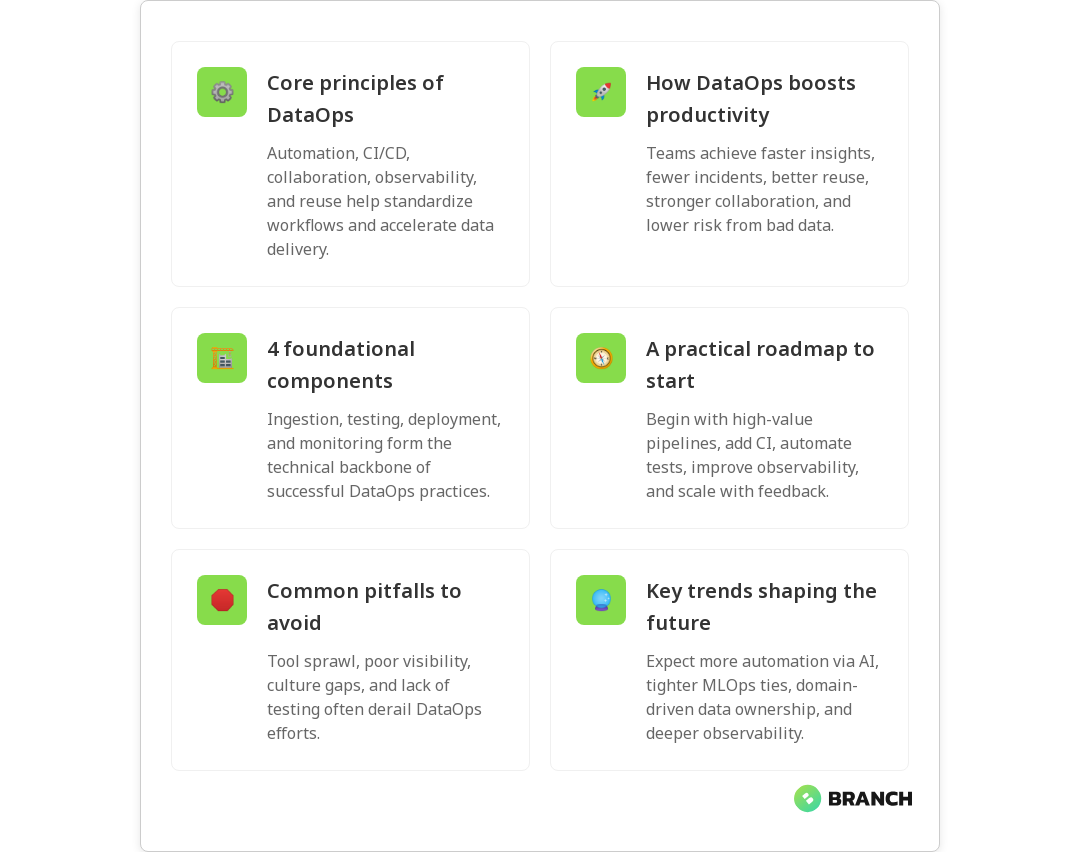
Core principles of DataOps

DataOps isn’t a checklist you mark off once; it’s a cultural and technical shift. Leaders in the field highlight a few shared principles:

  • Automation: Remove repetitive manual steps with pipelines, testing, and deployment automation to reduce human error.
  • Collaboration: Break down silos between data engineers, analysts, operations, and business stakeholders so everyone shares ownership of outcomes.
  • Continuous delivery and integration: Apply CI/CD for data and analytics so changes reach production quickly and safely.
  • Monitoring and observability: Treat data pipelines like software systems — instrument them to detect anomalies, performance issues, and data drift.
  • Reusable assets: Build shared data assets, templates, and modules to speed development and standardize quality.

Alation summarizes these ideas well and connects them to practical processes for making analytics repeatable and reliable; their piece on defining DataOps is a useful read for teams shaping policy and tooling (Alation).

The four primary components of DataOps

Different experts phrase components slightly differently, but most agree on four pillars that operationalize the principles above:

  1. Data ingestion and orchestration: Reliable, scheduled, and event-driven pipelines that move data from sources to storage and processing systems.
  2. Data quality and testing: Automated validation, schema checks, and unit/integration tests to ensure accuracy before data reaches consumers.
  3. Deployment and CI/CD: Version-controlled transformations and automated deployments for analytics assets and pipelines.
  4. Monitoring and feedback loops: End-to-end observability with alerts, lineage, and feedback channels so problems are found and fixed quickly.

In practice, these components are implemented with a mix of engineering skills, cloud services, and governance — and when they’re stitched together thoughtfully, productivity leaps. Splunk’s overview of DataOps gives a pragmatic view of pipeline orchestration and observability practices that help teams scale (Splunk).

Read more: Tailored AI Solutions – learn why a thoughtful approach to data tooling and governance is essential when building bespoke AI and analytics systems.

How DataOps transforms productivity — concrete benefits

“Productivity” for a data team isn’t just lines of code — it’s faster delivery of reliable answers that stakeholders can trust. Here’s how DataOps boosts that productivity in measurable ways:

  • Faster time-to-insight: Automated pipelines and deployment mean analysts and product teams get access to up-to-date data sooner.
  • Less firefighting: Monitoring and alerting reduce time spent on surprises and emergency fixes so engineers can focus on improvements.
  • Higher reuse and consistency: Shared modules and templates cut duplicate work and speed onboarding for new team members.
  • Better collaboration: Clear ownership, shared processes, and cross-functional reviews reduce handoff friction between teams.
  • Reduced risk: Tests and approvals in CI/CD reduce the chance that a broken pipeline or bad data propagates to reports or ML models.

In short: fewer interruptions, faster releases, and more predictable outcomes. Informatica frames this as systems thinking across the data lifecycle, which aligns stakeholders and simplifies delivery (Informatica).

Practical roadmap: how to implement DataOps

Implementing DataOps doesn’t require you to rip out your stack overnight. Follow a pragmatic, phased approach:

  1. Map your value streams: Identify the highest-value pipelines (reporting, ML features, billing data) and target them first.
  2. Introduce source control and CI: Store transformations and pipeline definitions in version control and add automated tests and build pipelines.
  3. Automate tests: Start with schema and regression tests, then expand to data quality and performance tests.
  4. Instrument end-to-end observability: Add lineage, metrics, and alerts so teams can detect problems early and measure SLAs.
  5. Standardize and reuse: Create libraries, templates, and documentation to reduce ad hoc work and accelerate new pipelines.
  6. Iterate and expand: Use feedback from the initial projects to adapt processes and scale across domains.

It helps to pair technical changes with cultural shifts: regular standups between engineering and analytics, blameless postmortems, and clear SLAs for data availability. Industry coverage suggests a move toward unified, domain-aware DataOps as teams decentralize responsibilities while keeping shared standards (DBTA).

💡 Tip: Automate the easiest, most frequent checks first — schema validation and freshness. Quick wins build confidence and free time for deeper automation.
Read more: Data Engineering Services – how tailored data engineering practices can build the reliable pipelines DataOps relies on.

Common challenges and how to avoid them

DataOps sounds great — but it’s not magic. Teams often stumble on a few recurring issues:

  • Tool sprawl: Too many disparate tools can make automation and governance harder.
  • Incomplete observability: If you can’t see data lineage or latency, you can’t fix the right problem.
  • Cultural resistance: Without buy-in from analysts and business stakeholders, DataOps becomes an engineering-only initiative.
  • Underinvesting in tests: Teams that treat tests as optional will see data regressions slip into production.

Address these by consolidating around a few flexible, well-integrated tools; documenting ownership and SLAs; and treating DataOps as a product that serves users, not just a platform engineers maintain.

Read more: Cloud Infrastructure Services – cloud practices and cost-conscious architecture that support reliable, scalable DataOps platforms.

Trends to watch

DataOps continues to evolve. Watch for these trends that will shape productivity gains in the next few years:

  • Domain-oriented DataOps: Teams decentralize data ownership by domain while preserving enterprise standards.
  • Increased automation with AI: Automated anomaly detection, data cataloging, and test generation reduce manual overhead.
  • Tighter integration with ML lifecycle: DataOps practices will more closely align with MLOps to ensure models get reliable, versioned data.
  • Stronger emphasis on observability: Tooling that provides lineage, drift detection, and SLA monitoring becomes standard practice.

As DataOps matures, it becomes less about a set of tactics and more about a repeatable operating model that lets data teams deliver value predictably. For organizations building AI and analytics, DataOps is no longer optional — it’s foundational.

Read more: AI Development Services – for teams connecting DataOps to AI, this explains how disciplined data practices support reliable models and business outcomes.

FAQ

What is meant by DataOps?

DataOps is a set of practices and cultural values that apply software engineering principles — automation, testing, CI/CD, and collaboration — to the data lifecycle. It enables faster delivery of reliable, high-quality data and analytics by treating pipelines like software products.

What are the key principles of DataOps?

The key principles include automation, collaboration, continuous integration and delivery, monitoring/observability, and reuse of data assets. These practices reduce manual effort, improve quality, and accelerate insights delivery.

What are the four primary components of DataOps?

The four primary components often cited are data ingestion and orchestration, data quality and testing, deployment and CI/CD for analytics assets, and monitoring with feedback loops and lineage. Together they create repeatable, resilient data pipelines.

What are the benefits of DataOps?

Benefits include faster time-to-insight, fewer production issues, higher reuse of data work, improved collaboration between teams, and reduced risks from data errors. DataOps supports scalable, trustworthy analytics while freeing teams to focus on higher-value work.

How to implement DataOps?

Start by mapping high-value data flows, introduce version control and CI/CD for transformations, add automated tests for data quality, implement observability and lineage, and build reusable components. Scale from a pilot to broader adoption while aligning stakeholders around SLAs and ownership.

Read more: Custom Software Development – here’s why building DataOps automation often benefits from bespoke development that fits your organization’s workflow and tooling.

DataOps isn’t a silver bullet, but it is the operating model that turns data from an unpredictable resource into a dependable asset. With the right mix of engineering practices, cultural alignment, and smart tooling, teams can spend less time fixing pipelines and more time building insights that move the business forward — and that’s productivity worth cheering for.

Rearview shot of an unrecognizable businesswoman giving a presentation in the office boardroom

LMS vs LXP for Corporate Learning

When you’re tasked with choosing a corporate learning platform, the alphabet soup of acronyms can feel overwhelming. LMS, LXP, LCMS – and that’s before vendors start throwing around terms like “AI-powered” and “next-generation.” But here’s the thing: behind the marketing jargon are two fundamentally different approaches to how people learn at work.

If you’re a learning and development leader, HR director, or operations manager evaluating digital learning solutions, this guide cuts through the noise. We’ll explore what Learning Management Systems (LMS) and Learning Experience Platforms (LXP) actually do, when each makes sense, and how to navigate the increasingly blurry line between them.

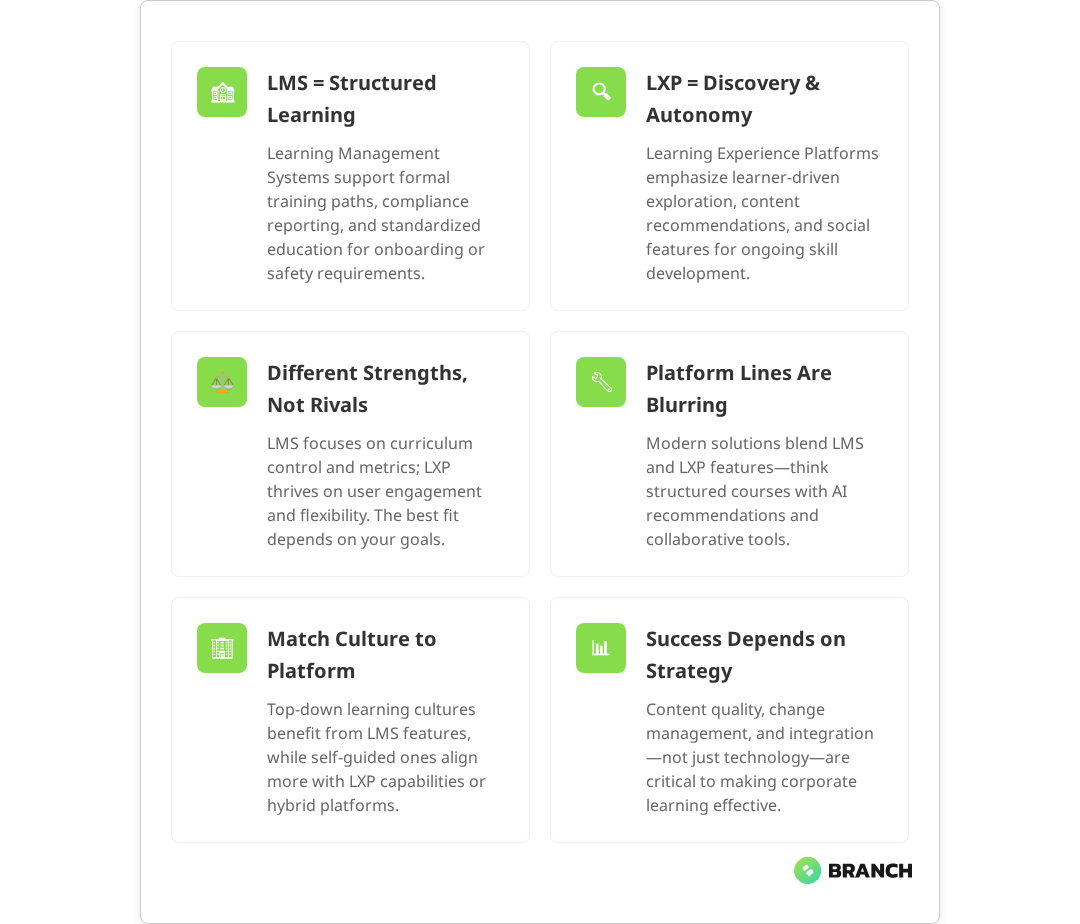
The Core Philosophy: Structure vs. Discovery

Think of an LMS as the digital equivalent of a traditional classroom. Research consistently shows that Learning Management Systems are designed around managed learning – with clear curriculums, assigned courses, tracked progress, and measurable outcomes. An LXP, on the other hand, works more like YouTube for professional development: Learning Experience Platforms prioritize discovery, social learning, and learner autonomy in driving their own educational journey.

This philosophical difference shapes everything else about how these platforms work:

  • LMS approach: “Here’s what you need to learn, when you need to learn it, and how we’ll measure your success.”
  • LXP approach: “Here are learning resources tailored to your interests – explore, share, and learn at your own pace.”

Neither approach is inherently better. The question is which one aligns with your organization’s learning culture, compliance requirements, and business objectives.

💡 Tip Before diving into platform features, clarify whether your primary goal is compliance training (LMS strength) or skill development and engagement (LXP strength). This single distinction will save you hours of evaluation time.

LMS: The Structured Learning Workhorse

Learning Management Systems excel at what their name suggests: managing the learning process. Multiple industry analyses confirm that LMSs are the go-to choice for organizations that need to deliver consistent training, track completion rates, and demonstrate compliance.

Core LMS Capabilities

  • Course administration: Create structured learning paths with prerequisites, deadlines, and automatic enrollment
  • Assessment and testing: Built-in quiz tools with detailed scoring and reporting
  • Compliance tracking: Generate reports for audits, certifications, and regulatory requirements
  • User management: Organize learners by department, role, or location with different access levels
  • SCORM compatibility: Support for industry-standard eLearning content formats

LMS platforms shine in scenarios where consistency and measurability matter most. Industry research demonstrates that LMS platforms are particularly well-suited for onboarding new hires, safety training, regulatory compliance, or any situation where you need to prove that specific learning objectives were met.

Read more about eLearning standards like SCORM and xAPI that impact platform compatibility.

LXP: The Social Learning Discovery Engine

Learning Experience Platforms flip the script by putting the learner in the driver’s seat. Current research shows that LXPs use recommendation algorithms, social features, and user-generated content to create a more engaging, personalized learning environment.

Core LXP Capabilities

  • Content aggregation: Pull learning resources from multiple sources, including external providers and user submissions
  • AI-powered recommendations: Suggest relevant content based on role, interests, and learning history
  • Social learning features: Peer-to-peer content sharing, discussion forums, and collaborative projects
  • Microlearning support: Bite-sized content designed for just-in-time learning
  • Mobile-first design: Optimized for learning on-the-go across devices

Expert analyses indicate that LXPs work best for organizations focused on upskilling, professional development, and creating a culture of continuous learning. They’re particularly effective for knowledge workers who need to stay current with rapidly changing industry trends.

What the research says

  • Platform convergence is real: Industry studies from 2025 confirm that modern hybrid platforms now offer comprehensive support for both structured courses and social learning features, making the traditional LMS vs LXP distinction less relevant.
  • AI personalization delivers results: Research shows that AI-powered recommendation systems in LXPs can effectively tailor learning paths based on user behavior, role requirements, and learning history, leading to higher engagement rates.
  • Compliance tracking remains essential: Multiple sources confirm that robust reporting capabilities for audits and regulatory compliance continue to be a critical differentiator for organizations in regulated industries.
  • Implementation success varies widely: Early studies suggest that platform choice matters less than implementation quality, change management, and content strategy, though more research is needed to establish definitive best practices.

The Reality: Platforms Are Blending Features

Here’s where things get interesting – and slightly frustrating for buyers. Current market analysis reveals that the strict distinction between LMS and LXP is increasingly a marketing construct rather than a technical reality. Modern platforms are adopting features from both camps, creating hybrid solutions that challenge the traditional categories.

Today’s LMS platforms often include social learning features, content recommendation engines, and mobile-responsive designs. Meanwhile, LXP vendors are adding formal course structures, assessment tools, and compliance reporting to appeal to enterprise buyers.

FeatureTraditional LMSTraditional LXPModern Hybrid
Structured coursesCore strengthLimitedComprehensive
Social learningLimitedCore strengthComprehensive
Compliance reportingCore strengthLimitedComprehensive
Content discoveryLimitedCore strengthComprehensive
Mobile optimizationVariableCore strengthExpected standard

This convergence means you should focus less on whether a platform calls itself an LMS or LXP and more on whether its specific capabilities match your organizational needs.

Making the Right Choice: Key Decision Factors

Rather than getting caught up in platform labels, consider these practical factors when evaluating corporate learning solutions:

Organizational Learning Culture

  • Top-down training culture: LMS-heavy approach works well for standardized training programs
  • Self-directed learning culture: LXP features become more valuable for employee engagement
  • Mixed culture: Look for hybrid platforms that support both structured and exploratory learning

Primary Use Cases

  • Compliance and onboarding: LMS capabilities are essential for tracking and reporting
  • Skill development and upskilling: LXP features help with discovery and engagement
  • Leadership development: Often benefits from hybrid approach combining structure with exploration

Technical Requirements

  • Integration needs: How well does the platform connect with your existing HR, payroll, and business systems?
  • Content standards: Do you need SCORM, xAPI, or other specific eLearning format support?
  • Scalability: Can the platform grow with your organization and handle peak usage periods?
Read more about professional eLearning development processes and platform considerations.

Beyond the Platform: Implementation and Success Factors

Choosing between LMS and LXP capabilities is just the first step. The success of your corporate learning initiative depends heavily on how well you implement and integrate the chosen platform with your broader learning strategy.

Content Strategy Matters More Than Platform

The most sophisticated platform won’t drive engagement without quality content that’s relevant to your learners’ daily challenges. Consider how you’ll source, create, and maintain learning materials – whether that’s through internal subject matter experts, external vendors, or user-generated content approaches.

Change Management Is Critical

Any new learning platform represents a change in how employees access professional development. Success requires clear communication about benefits, adequate training on the new system, and ongoing support to build adoption habits.

Measurement and Iteration

Whether you choose an LMS, LXP, or hybrid approach, establish clear metrics for success beyond simple completion rates. Look at engagement patterns, knowledge retention, performance improvements, and employee feedback to continuously refine your learning strategy.

Working with Learning Technology Specialists

Implementing a corporate learning platform involves more than selecting software. It requires understanding your organization’s unique learning needs, integrating with existing systems, and creating a sustainable content strategy.

Experienced eLearning development teams can help you navigate the technical complexities while keeping focus on the human side of learning. They can assess your current training processes, recommend appropriate platform capabilities, and design custom content that works within your chosen system.

Whether you need help with custom eLearning development, LMS implementation services, or want to see how other organizations have successfully deployed learning platforms like our H-E-B corporate LMS case study, the key is finding partners who understand both the technical requirements and the learning objectives.

The Bottom Line: Focus on Learning Outcomes

The LMS vs LXP debate often misses the most important point: successful corporate learning happens when you align platform capabilities with how your people actually work and learn. Some organizations thrive with structured, compliance-focused approaches. Others need discovery-driven, social learning environments. Many need elements of both.

Instead of choosing based on platform labels, evaluate specific capabilities against your organizational needs. Look for vendors who ask about your learning objectives before pitching features. And remember that the best learning platform is the one your employees will actually use to develop skills that matter to your business.

The future of corporate learning isn’t about picking the right acronym – it’s about creating learning experiences that fit naturally into how your team works and grows together.

FAQ

Can an LMS do everything an LXP does, or vice versa?

Modern platforms increasingly blur these lines, with many LMS solutions adding social features and recommendation engines while LXPs incorporate formal course structures. However, platforms still tend to excel in their core strength – LMS for structure and compliance, LXP for discovery and engagement. The key is finding a solution that covers your primary use cases well rather than trying to do everything.

How do I know if my organization needs LMS or LXP capabilities?

Start by identifying your primary learning objectives. If you need to deliver consistent training, track completion for compliance, or manage formal certification programs, LMS capabilities are essential. If your focus is on skill development, employee engagement, and self-directed learning, LXP features become more valuable. Many organizations benefit from hybrid approaches that support both structured and exploratory learning.

What's the typical implementation timeline for a corporate learning platform?

Implementation timelines vary significantly based on platform complexity, integration requirements, and content migration needs. Simple LMS deployments might take 2-3 months, while comprehensive enterprise implementations with custom integrations can take 6-12 months. The content development and user training phases often take longer than the technical setup, so plan accordingly for change management and adoption activities.

How do learning platforms integrate with existing HR and business systems?

Most modern learning platforms offer API integrations with common HR information systems (HRIS), payroll systems, and business applications. This enables automatic user provisioning, single sign-on, and data synchronization. However, integration complexity varies significantly based on your existing tech stack. It's important to map out integration requirements early in the evaluation process and factor in potential custom development work.

Should we build a custom learning platform or buy an existing solution?

Unless you have very unique requirements or significant technical resources, buying an existing platform is typically more cost-effective and faster to implement. However, custom development makes sense if you need highly specific integrations, have complex workflow requirements that don't fit standard platforms, or want to create a learning experience that's tightly integrated with your existing business applications. Consider hybrid approaches that customize or extend existing platforms rather than building from scratch.

datasync-image-blog

Change Data Capture (CDC): The Complete Guide to Real-Time Data Sync

Change Data Capture (CDC) is the quiet hero behind real-time dashboards, synced microservices, and analytics that don’t feel ancient the moment they’re displayed. Whether you’re building a customer 360, powering event-driven apps, or keeping a data warehouse fresh, CDC helps systems propagate only what changed — fast and efficiently. In this guide you’ll get a clear view of what CDC is, how it works, implementation patterns, common pitfalls, and practical tips to adopt it without turning your DBAs into caffeine-fueled detectives.

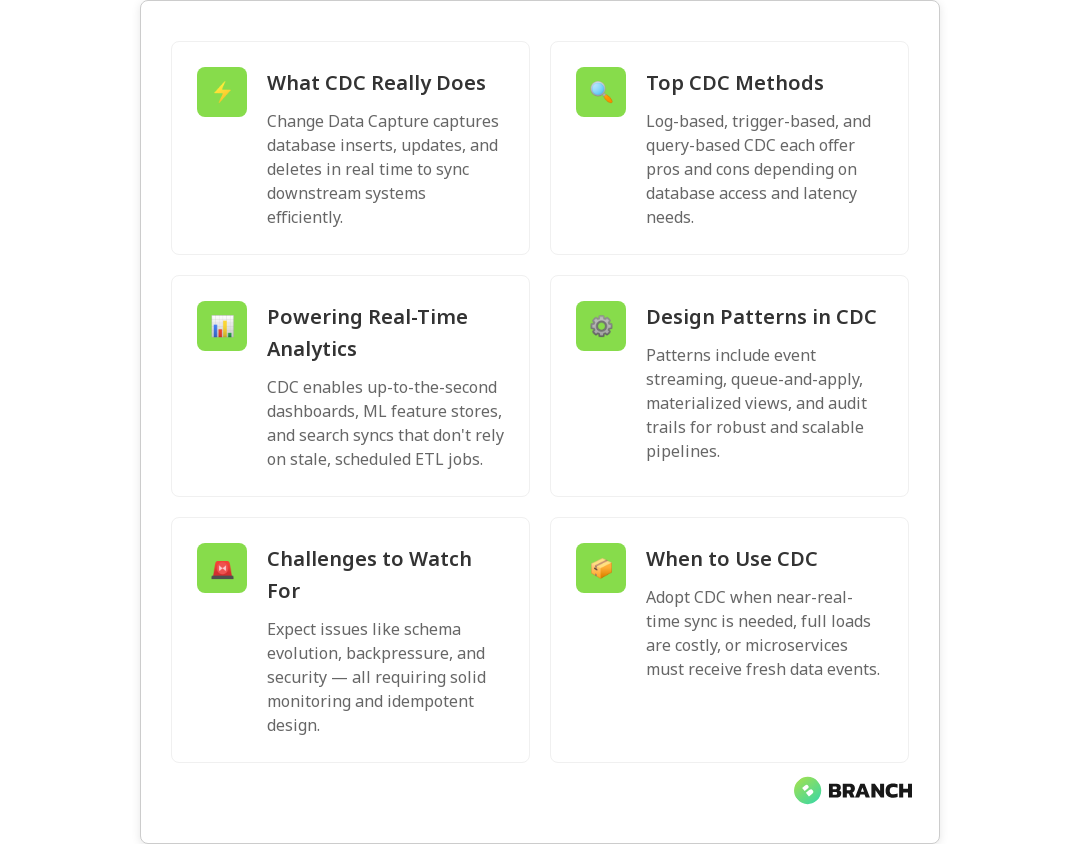
Why CDC matters for modern businesses

Batch jobs have their place, but business moves fast. Waiting minutes or hours for ETL windows to finish means stale insights and slow product experiences. CDC captures inserts, updates, and deletes as they happen so downstream systems — analytics, search indexes, caches, and ML features — receive changes continuously. That brings lower latency, smaller data movement, and often a lower operational cost than repeatedly full-loading big tables.

When implemented correctly, CDC supports event-driven architectures and real-time analytics while minimizing impact on operational databases. For a technical primer on the common CDC approaches and their tradeoffs, see this practical overview at GeeksforGeeks.

💡 Tip: Start by identifying which tables truly need real-time sync — not every table does. Prioritize transactional or frequently-read datasets to get the most business value for the investment.

Core CDC approaches (and when to use them)

CDC isn’t one-size-fits-all. Choose the approach that matches your database, latency needs, and ops tolerance.

  • Log-based CDC — Reads database write-ahead logs (WAL, binlog, redo log). Low impact on source systems and suited for high-volume production systems. This is the most common recommendation for minimal latency and load. See an explanation of real-time change tracking at Informatica.
  • Trigger-based CDC — Database triggers write changes to a shadow table. Works when you can’t access logs, but adds overhead and complexity to schema and migrations.
  • Query- or timestamp-based CDC — Periodically queries for rows updated after a timestamp. Simple, but can miss edge cases or create heavier loads and higher latency.
  • Hybrid approaches — Combine log-based capture with business-level change enrichment in downstream processors for auditability or complex event creation.

How CDC fits into data architecture

CDC typically sits between the operational systems and your downstream consumers. The flow looks like:

  1. Capture: CDC component reads change events (log/trigger/query).
  2. Transform: Optional enrichment, masking, or normalization.
  3. Transport: Publish events to a messaging layer (Kafka, Kinesis) or push directly to targets.
  4. Apply: Sink connectors or consumers apply changes to data warehouses, search, caches, or analytic systems.

This pattern supports event-driven apps and feeds ML feature stores with fresh data. For practical considerations when evaluating CDC tools and streaming architectures, check this guide from Data Engineering Weekly.

Read more: Data Engineering for AI – Learn why well-built data pipelines are the foundation that makes reverse ETL reliable and repeatable.

Common CDC design patterns

When building CDC pipelines you’ll repeatedly use a few reliable patterns:

  • Event streaming — Emit change events into Kafka/Kinesis and handle ordering, compaction, and schema evolution at the consumer layer.
  • Queue-and-apply — For smaller scale, queue changes and have idempotent apply logic on sink systems.
  • Materialized views — Use CDC to keep derived tables or denormalized structures updated for fast reads.
  • Audit trail — Persist change history for compliance, rollback, or replaying changes into test environments.
💡 Tip: Make your apply logic idempotent — updates may be delivered more than once. Idempotency keeps downstream state correct without complex coordination.

Tooling and evaluation

There’s a growing ecosystem of CDC tools and platforms: open-source connectors (Debezium), cloud-managed CDC services, and integrated ETL/ELT products. Evaluating tools means balancing these factors: source compatibility, latency, throughput, ease of schema evolution, delivery guarantees, monitoring, and operational burden.

When assessing options, consider whether the tool supports log-based capture for your DB, how it handles schema changes, and whether it integrates with your message bus and sinks. For a point-by-point evaluation guide, read this overview from Data Engineering Weekly.

Read more: Data Engineering Services – If you need help building the warehouse models and pipelines that feed reverse ETL, this explains how we approach data engineering projects.

Challenges and pitfalls to watch for

CDC simplifies many problems, but it introduces others:

  • Schema evolution: Column additions, type changes, or table renames can break connectors unless you plan for versioning and compatibility.
  • Backpressure and ordering: High write spikes can overwhelm pipelines; ordering guarantees vary by tool and transport layer.
  • Data correctness: Capturing the change is only half the battle — reconciling eventual consistency and handling deletes requires careful design.
  • Security and privacy: Sensitive data may flow through change streams; apply masking or tokenization in the transformation step.
  • Operational complexity: CDC adds more moving parts — monitoring, offset management, and disaster recovery planning are essential.
💡 Tip: Implement a reconciliation job (daily or hourly) that compares key aggregates between source and sink to detect drift early.

Real-world use cases

CDC powers a surprising variety of business needs:

  • Real-time analytics: Fresh dashboards and alerts for product and ops teams.
  • Search/index sync: Keep search services and recommendation engines fresh as product or user data changes.
  • Microservices integration: Broadcast events to other services without tight coupling.
  • Data lake/warehouse updates: Incremental updates to analytical stores without full reloads, reducing cost and time.
  • Auditing and compliance: Maintain immutable trails of changes for regulatory requirements.

For practical examples of CDC used in data lake and warehouse synchronization, see this explanation from Striim.

Read more: Tailored AI Solutions – learn how near-real-time features and RAG strategies rely on fresh, well-engineered data pipelines.

CDC versus traditional ETL/ELT

CDC and ETL/ELT solve overlapping but distinct problems. Traditional ETL moves bulk data on schedules; CDC moves incremental changes continuously. ETL is simpler for full refreshes or initial migrations; CDC is better for low-latency needs and reducing load on source databases. You’ll often see hybrid architectures: CDC streams changes to a landing zone where ELT jobs perform heavier transformations.

The cloud and modern data tooling make it easy to combine both: use CDC for incremental freshness and ELT for periodic deep transformations.

Monitoring, observability, and testing

Operational CDC needs robust observability:

  • Track offsets and lag so you know how far behind each sink is.
  • Monitor throughput, error rates, and repeat deliveries.
  • Build automated tests that simulate schema changes and verify downstream behavior.
  • Log a reconciliation metric and alert on divergence thresholds.
💡 Tip: Treat your CDC pipeline like a product — include SLOs for lag and accuracy, and make those SLOs visible to stakeholders who rely on the data.

Security, compliance, and governance

Because CDC streams operational data, it must meet the same compliance and security controls as the source systems. Consider encryption of data in flight, role-based access to change logs, and transformation-stage masking for sensitive fields. Catalog and schema registry integration will help teams understand what fields are flowing and where.

Products and documentation from established vendors outline common best practices; for an industry-level view of CDC’s role in incremental data movement and low-impact synchronization, see Matillion’s explanation.

Choosing the right time to adopt CDC

Not every organization needs immediate CDC. Consider starting CDC when:

  • You need sub-minute freshness for key use cases.
  • Full-table refreshes are taking too long or costing too much.
  • Downstream services rely on near-real-time events or materialized views.

Start with a limited scope: one database or set of tables, with clear success metrics. Iterate and expand once you’ve proven stability and business value.

FAQ

What is change data capture?

Change Data Capture (CDC) is a set of techniques to detect and record changes (inserts, updates, deletes) in a source database, and then propagate those changes to downstream systems in an incremental, often real-time fashion. It reduces the need for full reloads and enables low-latency data flows for analytics and event-driven systems.

What is the CDC process?

The CDC process typically involves capturing changes from the source (via logs, triggers, or queries), optionally transforming or masking the events, transporting them through a messaging layer or directly to sinks, and applying those changes to downstream targets. Monitoring and reconciliation ensure accuracy.

How does change data capture work?

CDC works by observing the source for changes. Log-based CDC reads the transaction log and converts entries to events. Trigger-based CDC uses database triggers to write changes to a side table. Query-based CDC polls for rows modified since a timestamp. Captured changes are then serialized and delivered to consumers.

What are the use cases of CDC?

CDC powers use cases like real-time analytics dashboards, search and index synchronization, keeping caches fresh, feeding ML feature stores, enabling event-driven microservices, and maintaining audit trails for compliance. It’s ideal where near-real-time freshness and minimal source impact are required.

What is the difference between ETL and CDC?

ETL (Extract, Transform, Load) performs bulk or scheduled data movement and transformation, while CDC streams incremental changes continuously. ETL is suited for initial loads and heavy transformations, whereas CDC enables low-latency sync and reduces load on production systems. Many architectures use both together.

Read more: AI Development Services – how fresh, well-engineered data feeds are critical for successful AI features and models.

Final thoughts

CDC is a practical and powerful pattern for modern data architectures. It reduces latency, lowers data movement costs, and enables event-driven use cases — when designed with attention to schema evolution, monitoring, and security. Start small, measure the impact, and expand. And if the first CDC pipeline you build makes your product feel a little bit faster and your analytics a little bit smarter — congratulations, you’ve just given your users a tiny bit of magic.

Read more: Data Engineering Services – if you want help designing or operating CDC pipelines tailored to your business goals and compliance needs.

For practical alternatives and vendor approaches to CDC, you might also find this vendor-neutral overview helpful: Striim CDC explainer, which walks through how changes flow from operational systems into analytics platforms and data lakes.

dataengineering-image-blog

Kubernetes vs Docker for Data Engineering: Container Orchestration Guide

Containers have become the Swiss Army knife of modern data engineering — compact, flexible, and occasionally surprising you with a handy tool when you least expect it. But when your data pipelines need to scale, heal themselves, and play nicely across clouds, the choice between Docker and Kubernetes stops being academic and starts being strategic. In this guide you’ll learn what each tool actually does, when to use Docker alone, when to step up to Kubernetes, practical strategies for production data pipelines, and how to avoid the common potholes teams hit on the road to a resilient orchestration setup.

Why container orchestration matters in data engineering

Data engineering workloads are no longer single, monolithic jobs that run on a VM and go to sleep. Modern pipelines are composed of many small services — extractors, transformers, model-serving endpoints, and observability agents — that must run reliably, scale with demand, and recover from failure automatically. This is where container orchestration comes in: it automates deployment, scaling, networking, and lifecycle management for containerized applications so you can focus on data logic instead of babysitting infrastructure.

For a practical, hands-on look at how virtualization, Docker, and Kubernetes tie into data engineering workflows, the Coursera course on virtualization, Docker, and Kubernetes is an excellent refresher.

Read more: Data Engineering for AI – a deeper look at why robust pipelines are critical when powering AI systems and how data infrastructure supports model performance.

Docker and Kubernetes — clarifying roles (they’re not direct competitors)

First, let’s clear a common misconception: Docker and Kubernetes serve different purposes. Docker is primarily a platform for building, packaging, and running containers. Kubernetes is an orchestration system for managing containers at scale across a cluster of machines. Think of Docker as the shipping container and Kubernetes as the port authority that coordinates thousands of containers arriving, docking, moving, and leaving.

The distinction is well summarized in practical guides like the Docker blog post on how Docker and Kubernetes work together and the Datacamp comparison article that breaks down roles and advanced Kubernetes features like self-healing and load balancing in clear terms (Datacamp: Kubernetes vs Docker).

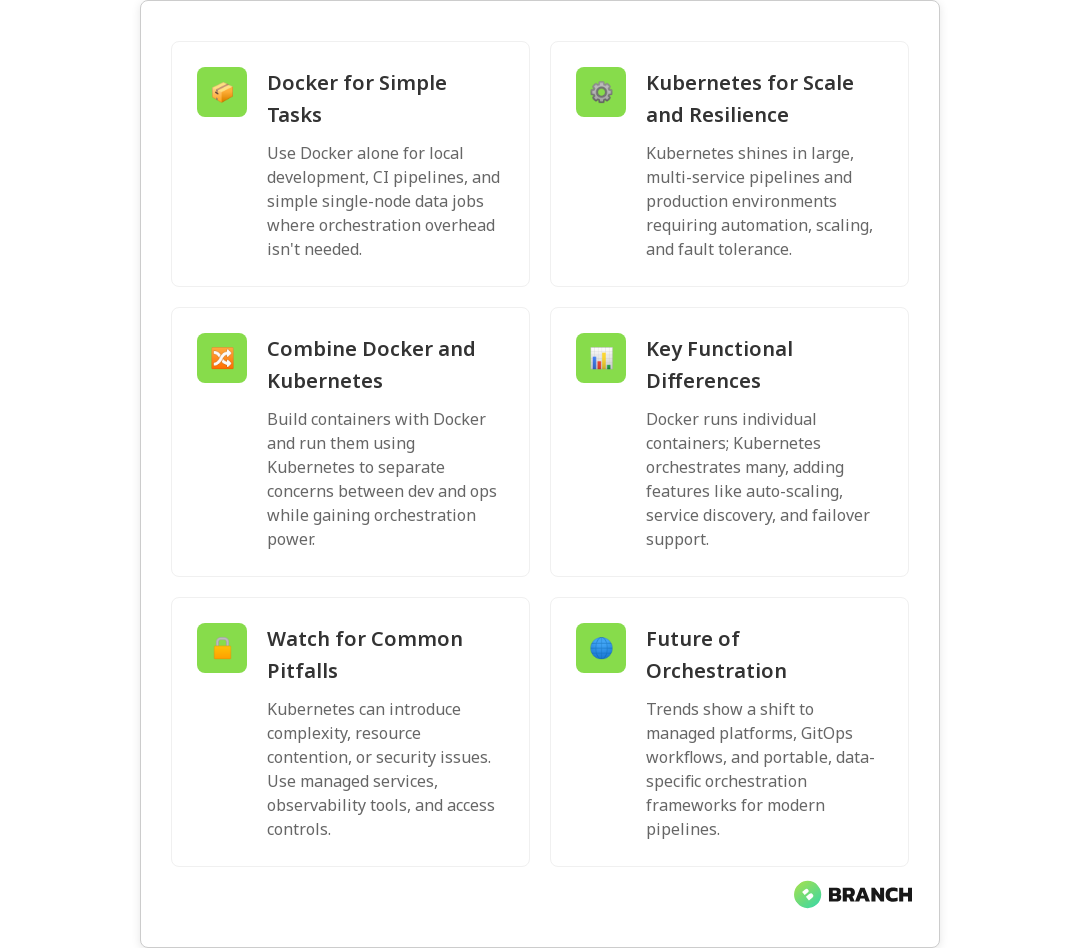
Key functional differences

  • Container creation and runtime: Docker builds images and runs single containers.
  • Orchestration and cluster management: Kubernetes manages groups of containers across many nodes, handling scheduling, scaling, and recovery.
  • Networking and service discovery: Kubernetes provides built-in load balancing and service abstractions suited to microservice and pipeline architectures.
  • Persistence and state: Kubernetes integrates concepts like PersistentVolumes, StatefulSets, and Jobs for stateful workloads and batch jobs common in data engineering.

When to use Docker alone (short pipelines, local dev, simple CI)

Docker alone is great when your needs are simple. Use Docker for:

  • Local development and testing of extract-transform-load (ETL) components.
  • CI pipelines that build and run containers for unit and integration tests.
  • Single-node processing or scheduled batch jobs where high availability and cluster-level scaling aren’t required.

If your pipeline is small, latency-insensitive, and managed through a single orchestrator (like a scheduler on a VM), Docker gives you repeatable environments with minimal operational overhead. It keeps things lightweight and fast to iterate.

Read more: Data Engineering Solutions – for how production-grade pipelines are architected beyond local containers into scalable, reliable systems.

When Kubernetes makes sense (scale, reliability, multi-service pipelines)

Choose Kubernetes when you need:

  • Elastic scaling across many services or tenants.
  • Self-healing so jobs restart automatically after node or Pod failures.
  • Advanced networking, service discovery, and observability across components.
  • Multi-cloud or hybrid deployments where portability and standardization matter.

Kubernetes shines in production environments where uptime, automation, and scale are priorities. If your data stack includes streaming systems, model-serving endpoints, and multiple microservices, Kubernetes provides the primitives to tie those pieces together reliably. For a beginner-friendly overview of orchestration options and portability, Splunk’s Container Orchestration guide is an approachable resource.

Hybrid approach: Docker + Kubernetes

In many real-world deployments you’ll use Docker to build images and Kubernetes to run them. CI/CD pipelines build Docker images, then Kubernetes handles rollout, scaling, and updates. This combo minimizes friction between development and operations while enabling production-grade orchestration.

💡 Tip: Start with Docker for local development and CI, then adopt Kubernetes incrementally. Prototype on managed offerings (EKS, AKS, GKE) or use local clusters like Kind or Minikube before migrating workloads.

Strategies for running containerized data pipelines

Here are practical strategies to make container orchestration work for data engineering, not against it:

  1. Design for idempotency and checkpointing. Data jobs should be restartable without duplicating results. Use checkpoints or metadata stores to track processed offsets or batches.
  2. Use Kubernetes Jobs and CronJobs for batch tasks. Kubernetes provides native primitives for one-off and scheduled jobs — ideal for nightly loads and backfills.
  3. Separate compute from storage. Keep state in managed object stores or databases, not container filesystems, so compute can scale independently.
  4. Automate observability. Integrate metrics, logs, and tracing early. Kubernetes makes it easy to attach sidecar containers or agents for telemetry.
  5. Leverage managed services where appropriate. Managed Kubernetes (GKE, EKS, AKS) and cloud-native serverless containers can simplify operations while retaining portability.
Read more: Cloud Infrastructure Services – for help deciding when to use managed cloud services vs. self-managed clusters and how to design secure, scalable cloud environments.

Common challenges and how to overcome them

Adopting containers and Kubernetes adds complexity. Here are the frequent problems teams hit and practical fixes:

  • Operational complexity: Kubernetes has a learning curve. Mitigate by using managed offerings, adopting GitOps practices, and investing in observability and runbooks.
  • Resource contention: Misconfigured requests and limits can lead to noisy neighbors. Use resource quotas, vertical/horizontal autoscaling, and testing under load.
  • Security and compliance: Containers introduce a supply chain. Harden images, scan for vulnerabilities, and apply network policies and RBAC.
  • Stateful workloads: Running stateful services in Kubernetes requires PersistentVolumes and careful consideration of data locality and backups.
💡 Tip: Treat orchestration like a product: define SLAs, create runbooks, and run regular chaos or failover drills so your team can recover quickly when things break.
Read more: AI Development Services – useful when connecting data pipelines to model-serving requirements and ensuring your models receive reliable inputs in production.

Trends and the future of orchestration in data engineering

The orchestration landscape keeps evolving. Here are trends to watch:

  • More managed and opinionated services: Cloud providers continue to deliver managed orchestration and serverless containers that reduce operational burden.
  • Tighter CI/CD and GitOps integration: Deployments are increasingly automated via declarative configs and GitOps workflows.
  • Specialized orchestration for data workloads: Frameworks and operators are emerging that focus on ML pipelines, feature stores, and streaming topologies.
  • Portability and standards: Kubernetes remains the common denominator for portability across cloud providers, reducing vendor lock-in concerns.

If you want a simple walk-through of Kubernetes adoption and why organizations are choosing it for reliability and security, MarutiTech’s guide on Kubernetes adoption provides practical context (MarutiTech: Kubernetes adoption).

Read more: Custom Software Development – to understand how containerized services fit into larger software architectures and product roadmaps.

FAQ

What is container orchestration?

Container orchestration is the automated management of containerized applications across clusters. It handles deployment, scaling, networking, health checks, and lifecycle management so apps run reliably without manual intervention.

How is Kubernetes different from Docker?

Docker is mainly for building and running containers. Kubernetes is an orchestration platform that manages containers at scale across multiple nodes. Teams typically use Docker to create images and Kubernetes to deploy and manage them in production.

What is Docker Swarm vs Kubernetes?

Docker Swarm is Docker’s built-in clustering and orchestration tool, simpler for small clusters. Kubernetes is more feature-rich and extensible, offering advanced scheduling, self-healing, and a large ecosystem, making it the dominant choice for complex workloads.

What is an advantage of using Kubernetes for container orchestration?

Kubernetes automates at scale: it provides self-healing, horizontal scaling, rolling updates, and service discovery. Together, these enable resilient, highly available pipelines without constant manual work.

What are the alternatives to Kubernetes?

Alternatives include Docker Swarm (simpler needs), Apache Mesos (large-scale systems), and serverless/container services like Google Cloud Run or AWS Fargate that abstract cluster management. Splunk’s overview provides a useful comparison.

💡 Tip: Don’t pick tools for popularity — pick them because they solve your constraints and let you iterate. Popularity helps with ecosystem support, but fit matters more.

Container orchestration is not a silver bullet, but when matched to your team’s needs and maturity, it gives data engineering teams the capacity to scale, recover, and deliver data products reliably. Start small, automate often, and remember: containers make reproducibility easy, orchestration makes reliability sustainable — and both together keep data pipelines moving without you having to fight fires at midnight.

dataworkflow-image-blog

Workflow Orchestration vs Traditional Job Scheduling in Data Pipelines

Data pipelines keep modern businesses humming — ingesting, transforming, and delivering data that teams and models rely on. But not all pipeline automation is created equal: classic job schedulers and modern workflow orchestration tools solve related problems in different ways. In this article you’ll learn the practical differences, why they matter for reliability and scale, and how to choose the right approach for your data environment.

We’ll walk through core concepts, common patterns, operational trade-offs, and real-world tips you can use when designing or modernizing pipelines. Expect clear comparisons, a few helpful metaphors, and one or two mildly nerdy jokes.

Why this distinction matters

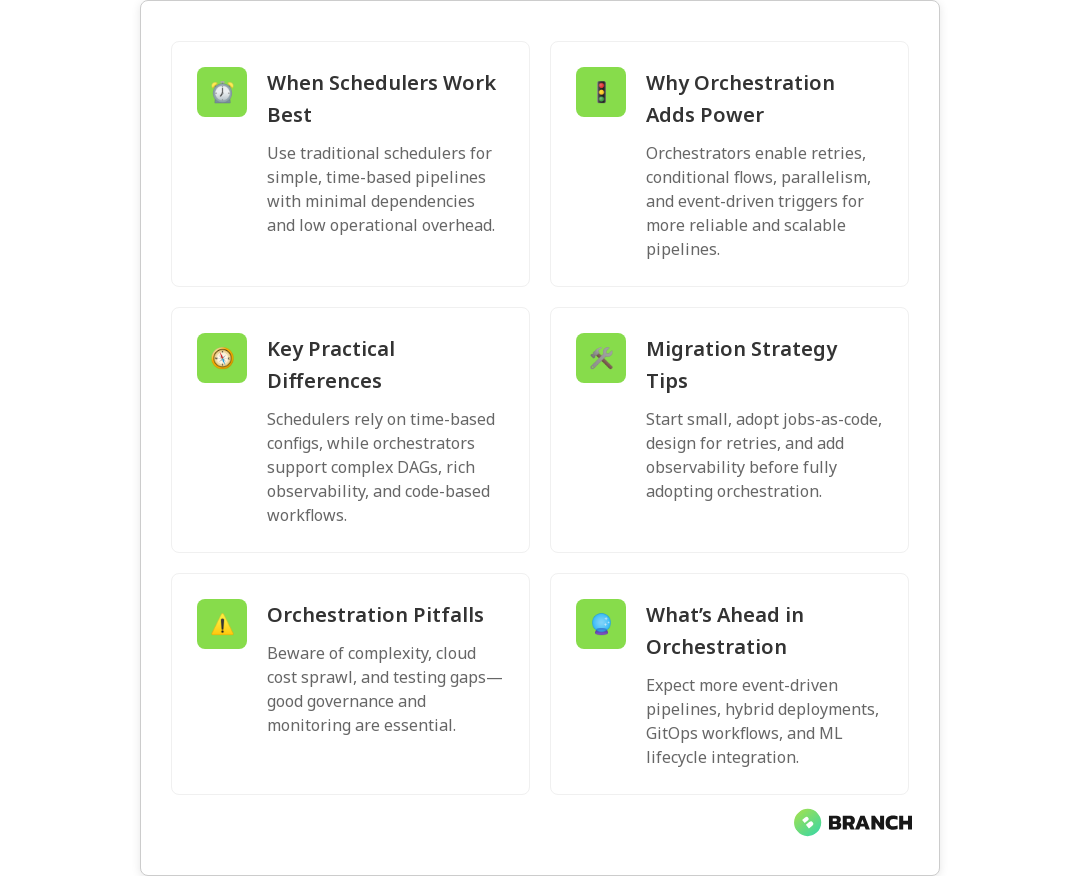
Traditional job scheduling (think cron or enterprise schedulers) triggers tasks at set times. Workflow orchestration coordinates multi-step, dependent tasks and reacts to events, failures, and changing resource needs. The difference affects resilience, observability, and how quickly you can ship data products like analytics, features, or ML models.

In short: if your pipelines are simple and time-based, a scheduler might be fine. If you need conditional logic, retries, parallelism, or environment promotion, orchestration often saves time and headaches.

Read more: Data Engineering for AI – why robust pipelines are foundational for AI and how orchestration plays a role.

What traditional job scheduling gets right

Traditional job schedulers are mature and familiar. They excel at:

  • Time-based execution (daily, hourly, cron expressions).
  • Simple dependency ordering in some enterprise schedulers (run job B after job A completes).
  • Low operational overhead for small teams and straightforward tasks.
  • Predictable behavior and often tight integration with existing enterprise systems.

However, they start to creak when you add complex branching, dynamic inputs, or the need for runtime scaling. That’s where modern orchestration shines.

What workflow orchestration adds

Workflow orchestration treats pipelines as composed graphs of tasks with explicit dependencies, conditional branches, retries, and observability. Orchestrators like Apache Airflow popularized the “jobs-as-code” pattern where pipelines are defined in code, versioned, and tested.

Key capabilities include:

  • Directed acyclic graph (DAG) modeling of task dependencies and conditional paths.
  • Event-driven triggers (file arrival, message queues, external APIs).
  • Automated retries, backoff strategies, and fine-grained failure handling.
  • Integration with dynamic resource managers and cloud services for scaling.
  • Visibility into pipeline state and runtime metrics for debugging and SLAs.

For a concise primer on these distinctions, see this practical guide to data orchestration and workflows from Orchestra.

Orchestra guide explains how orchestration tools enable more robust ETL and ML pipelines through event-driven and error-handling patterns.

Side-by-side: Practical differences

Here’s a quick comparison to ground the theory.

  • Trigger model: Schedulers = time-based; Orchestrators = time + event + API-driven.
  • Complexity: Schedulers = linear or simple DAGs; Orchestrators = complex DAGs, conditional logic, dynamic task generation.
  • Failure handling: Schedulers = job-level failure notifications; Orchestrators = retries, partial recoveries, granular checkpoints.
  • Observability: Schedulers = logs; Orchestrators = rich dashboards, lineage, metrics.
  • Deployment & testing: Schedulers = config-driven; Orchestrators = code-driven (better for CI/CD).

For an enterprise perspective that distinguishes job scheduling from broader workload automation, BMC’s overview is a solid read.

BMC blog highlights how orchestration and workload automation expand on classic scheduling with environment promotion and multi-cloud management.

💡 Tip: Start by mapping your current pipeline: note triggers, dependencies, runtimes, SLAs, and pain points. That map reveals if you truly need orchestration or just smarter scheduling.

When traditional scheduling is enough

Use a scheduler when:

  • Your pipelines are mostly time-based (e.g., nightly ETL jobs) with simple dependencies.
  • Low operational complexity is a priority and teams are small.
  • Jobs are idempotent, long-running state isn’t required, and failures can be retried manually.
  • Cost is a concern and you want to avoid the overhead of a new orchestration platform.

Schedulers are a perfectly valid choice for many organizations. The key is recognizing the breakpoint where manageability costs exceed tool simplicity.

When orchestration is the better choice

Consider orchestration when:

  • Pipelines have many steps, branches, or conditional logic.
  • You need event-driven execution (e.g., process data as it arrives) or sub-hour SLAs.
  • You want reproducibility through “jobs-as-code”, CI/CD promotion, and versioning.
  • Granular failure recovery (resume from a checkpoint) or parallel processing is critical.
  • You need visibility into task lineage and metrics for debugging and compliance.

Orchestration shines in modern data platforms that serve analytics, product features, and ML systems where downtime or data quality issues are costly.

Read more: Data Engineering Services – how we design pipelines and why orchestration often becomes essential when building reliable data infrastructure.

Implementation strategies and best practices

Moving from a scheduler to an orchestrator — or introducing orchestration for the first time — is a project, not just a configuration change. Here are pragmatic steps:

  1. Inventory and categorize jobs: Which are simple, which are complex, which are critical?
  2. Start small: Port a non-critical pipeline to orchestration as a pilot to validate patterns and workflows.
  3. Adopt jobs-as-code: Store DAGs/workflows in version control and integrate with CI/CD for testing and promotion.
  4. Design for idempotency and retries: Ensure tasks can be safely re-run and partial failures are manageable.
  5. Instrument observability: Metrics, logs, and lineage make debugging and SLA tracking possible.
  6. Plan cost and resource management: Orchestration often enables dynamic scaling, but that requires governance.

For guidance on pipeline-level concerns like failure recovery and dynamic allocation, see this practical overview of data orchestration capabilities.

Integrate.io guide discusses granular failure recovery and scalable orchestration infrastructure.

💡 Tip: When testing orchestration, simulate real failures — network issues, partial corruption, throttling — not just the happy path.

Common challenges and pitfalls

Migrating to orchestration introduces some new operational realities:

  • Complexity creep: Orchestrators give power, and power can lead to overly complex DAGs. Favor modular tasks and simple DAGs over monoliths.
  • Resource sprawl: Dynamic scaling can increase cloud costs if not monitored and governed.
  • Operational overhead: Running and securing an orchestration platform requires expertise and runbooks.
  • Testing and observability gaps: Code-driven workflows need robust testing and monitoring frameworks to avoid unexpected behavior.

Address these by enforcing coding standards for DAGs, automated tests, cost-monitoring alerts, and role-based access controls.

Read more: Cloud Infrastructure Services – for guidance on cost optimization and governance when running orchestrators in cloud environments.

Trends and what’s next

Workflow orchestration is evolving quickly. A few trends to watch:

  • Event-driven and real-time orchestration: As streaming use cases grow, orchestrators will increasingly support event-first patterns.
  • Jobs-as-Code + GitOps: CI/CD for workflows is becoming standard, enabling safer promotion across environments.
  • Hybrid and multi-cloud orchestration: Tools and patterns that abstract cloud differences are gaining traction for portability.
  • Integration with ML lifecycle tools: Orchestration layers are more tightly integrating model training, validation, and deployment.

For a high-level view on end-to-end orchestration including ETL, streaming, and model deployment, Rivery’s guide offers a useful framework.

Rivery orchestration guide covers end-to-end patterns and considerations for production data flows.

💡 Tip: Choose the right level of orchestration. Not every team needs a full Airflow cluster. Start with a clear problem, then match the tool to the use case.

Choosing the right tool — practical checklist

  • Do you need event-driven triggers or just time-based jobs?
  • Are pipelines simple or do they require branching, parallelism, and retries?
  • Does your team have the skillset to maintain a workflow platform, or would managed services be preferable?
  • How important are observability, lineage, and reproducibility for audits and debugging?
  • What are your cost constraints and cloud governance requirements?

Answering these questions will help you pick between lightweight schedulers, managed orchestrators, or self-hosted platforms.

Read more: Custom Software Development – if you need bespoke pipeline integrations, custom tooling, or CI/CD automation as part of your orchestration strategy.

FAQ

What is meant by workflow orchestration?

Workflow orchestration is the automated coordination and management of interdependent tasks in a data pipeline, application process, or ML lifecycle. It manages sequencing, conditional logic, retries, error handling, and triggers to ensure workflows run reliably and transparently.

What are workflow orchestration tools?

Workflow orchestration tools are platforms that let you define, schedule, monitor, and retry complex workflows. Examples include Apache Airflow, Prefect, and commercial managed services. These tools provide DAG modeling, observability, and integrations with cloud systems.

What is the difference between ETL and workflow orchestration?

ETL describes the extract-transform-load pattern for moving and shaping data. Workflow orchestration coordinates the steps that make up ETL and other processes. Think of ETL as the work, and orchestration as the conductor ensuring the orchestra plays in sync and handles missed cues.

Is Apache Airflow a workflow orchestration tool?

Yes. Apache Airflow is a widely used workflow orchestration platform that models pipelines as DAGs in code, supports scheduling and event triggers, and provides monitoring, retries, and integrations for cloud and on-prem systems.

What are the components of workflow orchestration?

Typical components include a scheduler/executor, a metadata and state store (for tracking task status), a user interface and API, integrations/connectors for data and compute, and logging/metrics for observability. Advanced setups also add authentication, RBAC, and CI/CD deployment pipelines.

Read more: AI Development Services – orchestration is especially important when operationalizing AI and ML models, from training to deployment and monitoring.

Whether you stick with a scheduler or adopt a full orchestration platform, the goal is the same: deliver reliable, observable, and maintainable pipelines that let your teams move faster. If you want help mapping your current state and choosing a path forward, we’d love to chat and share battle-tested patterns (and possibly a few more nerdy jokes).

largelanguagemodels-image-blog

What LLMOps Is (and Why It’s the Next Evolution of MLOps)

Large language models (LLMs) have gone from research curiosities to business-critical tools almost overnight. As companies race to build chatbots, assistants, and content engines, the operational question becomes: how do you manage these powerful but complex systems reliably and responsibly? This article explains LLMOps — the emerging practices and tooling tailored for LLMs — why it matters, how it differs from traditional MLOps, and practical steps your team can take to deploy LLMs at scale.

Why LLMOps matters now

LLMs bring new capabilities — fluent generation, long-form reasoning, and multimodal inputs — but they also introduce unique operational challenges. Model sizes, latency sensitivity, prompt drift, safety risks, and costly fine-tuning all mean the old MLOps playbook needs an upgrade. Organizations that treat LLMs like smaller machine learning models risk outages, hallucinations, privacy breaches, and ballooning cloud bills.

LLMOps is the discipline that stitches together lifecycle automation, monitoring, governance, and infrastructure optimization specifically for LLMs. For a solid overview of LLM-specific lifecycle automation and best practices, see the practical guide from Red Hat.

LLMOps vs. MLOps: what’s really different?

On the surface, both LLMOps and MLOps cover data, training, deployment, and monitoring. The differences show up when you dig into the details:

  • Model interaction: LLMs are often interacted with via prompts and embeddings rather than fixed feature pipelines. Managing prompt engineering and prompt versioning is unique to LLMOps.
  • Cost & scale: LLM inference and fine-tuning can be orders of magnitude more expensive than traditional models, pushing teams to optimize for caching, batching, and model selection.
  • Observability: Instead of only numeric metrics, LLMOps needs behavioral monitoring — e.g., hallucination rates, toxic output, and alignment regressions.
  • Governance & safety: Human-in-the-loop moderation, red-teaming, and content filters are first-class concerns, not afterthoughts.

For a side-by-side comparison and guidance on operational best practices tailored to LLMs, Google Cloud’s explainer on the LLMOps lifecycle is a useful resource: What is LLMOps.

Key aspects of LLMOps

LLMOps pulls together a set of practices that support safe, reliable, and cost-effective LLM production systems. Some of the core aspects include:

  • Prompt and instruction management: Versioning prompts and templates, A/B testing phrasing, and capturing contextual signals used at inference time.
  • Data curation for fine-tuning and retrieval: Building clean, representative datasets for supervised fine-tuning and retrieval-augmented generation (RAG) indexing.
  • Model lifecycle automation: Pipelines for fine-tuning, evaluation, deployment, and rollback specific to large models.
  • Observability and metrics: Monitoring latency, cost per request, content quality metrics (e.g., hallucination rate), and user satisfaction signals.
  • Infrastructure orchestration: Specialized hardware management (GPUs/TPUs), model sharding, and cost-aware serving strategies.
  • Safety, governance, and compliance: Prompt redaction, PII detection, access controls, and audit trails for model outputs.

Wandb’s article on understanding LLMOps provides a practical look at development and deployment tools tailored for LLMs and how LLMOps extends MLOps practices in real projects: Understanding LLMOps.

💡 Tip: Treat prompts, retrieval indexes, and post-processing as first-class artifacts. Version them, test them, and include them in CI to avoid “works in dev, fails in prod.”

LLMOps lifecycle: practical stages

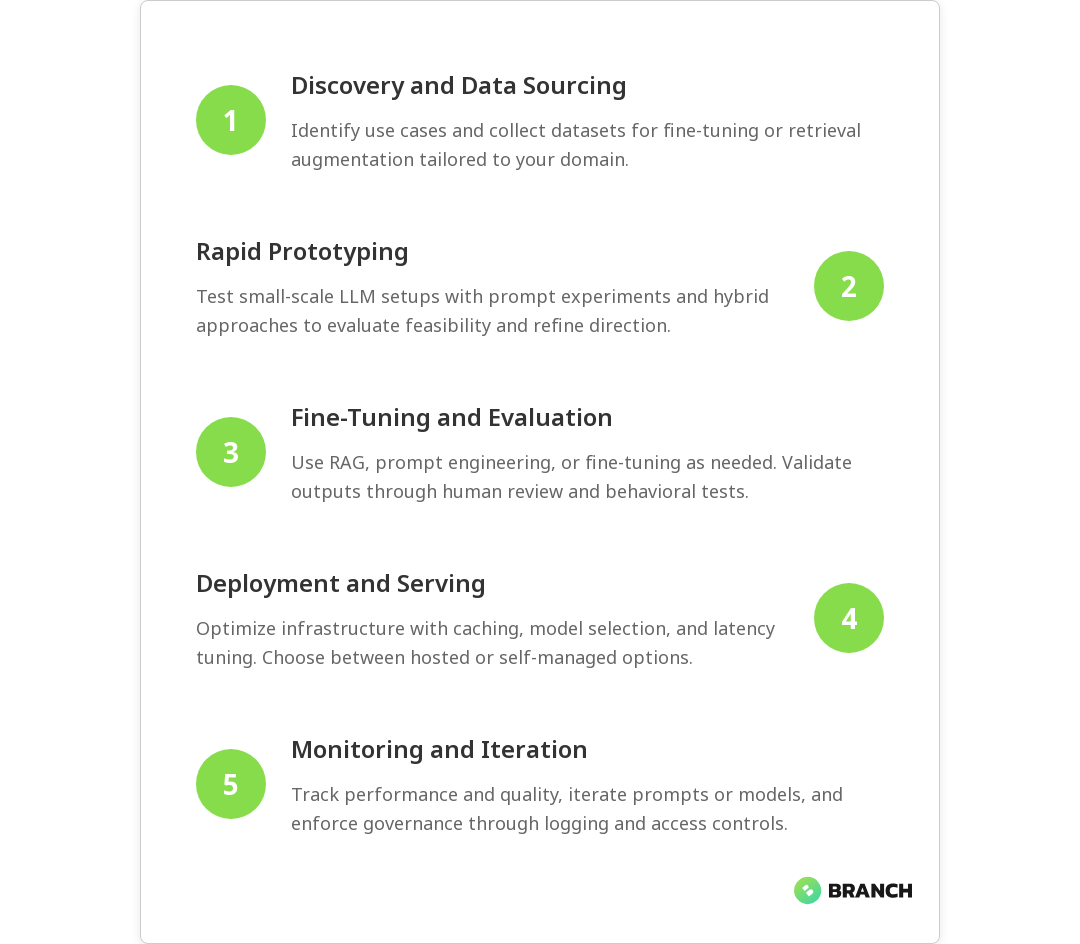
The LLMOps lifecycle is similar to MLOps in shape but different in content. A practical lifecycle might look like this:

  1. Discovery & sourcing: Identify use cases and collect domain-specific datasets and knowledge sources for retrieval augmentation.
  2. Prototyping: Rapidly iterate with small-scale tests, prompt experiments, and hybrid approaches (e.g., API + local cache).
  3. Fine-tuning & evaluation: Fine-tune when necessary; otherwise focus on RAG and prompt engineering. Use human evaluation and automated behavioral tests.
  4. Deployment & serving: Choose between hosted APIs, managed services, or self-hosting. Implement caching, model selection, and latency optimization.
  5. Monitoring & feedback: Track both system performance and content quality. Feed user feedback into retraining or prompt adjustments.
  6. Governance & iteration: Maintain access controls, audit logs, and safety checks. Iterate based on business needs and risk assessments.

Red Hat emphasizes lifecycle automation and continuous iteration for LLMs — automating as much of this sequence as possible reduces human error and improves reliability: LLMOps lifecycle automation.

Strategies to run LLMs effectively in production

Operationalizing LLMs requires a mix of engineering, data work, and governance. Here are practical strategies to adopt:

  • Hybrid inference architecture: Use a mix of smaller, cheaper specialized models for routine tasks and larger models when high quality or deeper reasoning is needed. This reduces cost and improves responsiveness.
  • Retrieval-augmented generation (RAG): Augment LLM output with vetted knowledge stores. RAG often delivers safer, more accurate responses than blind generation and reduces model fine-tuning needs.
  • Prompt testing and canary rollouts: Treat prompt changes like code changes — test and roll out gradually while monitoring key behavioral metrics.
  • Human-in-the-loop for safety: Route high-risk or ambiguous outputs for human review, especially in regulated domains like healthcare or finance.
  • Cost observability: Track per-request compute and storage costs; use autoscaling, batching, and request prioritization to control spend.

PagerDuty’s guide to LLMOps highlights governance frameworks and operational performance optimization for running LLMs reliably, which is helpful when designing incident and escalation plans: LLMOps governance.

Read more: Data Engineering AI – Understand why high-quality, well-architected data pipelines are essential for reliable LLM performance.

Challenges you’ll face (and how to approach them)

LLM projects can fail for technical and organizational reasons. Here are common pitfalls and how to mitigate them:

  • Hallucinations and factual errors: Mitigation: RAG, grounding, and post-generation verification checks.
  • Data privacy and compliance: Mitigation: PII detection, prompt redaction, and secure retrieval stores with access controls.
  • Model drift and prompt decay: Mitigation: Continuous evaluation, user feedback loops, and scheduled retraining or prompt updates.
  • Cost overruns: Mitigation: Mixed model sizes, caching common responses, and careful autoscaling rules.
  • Tooling gaps: Mitigation: Combine MLOps platforms with LLM-specific tooling (prompt stores, RAG orchestrators) and invest in custom automation when needed.

Many teams find that evolving their CI/CD and monitoring pipelines to incorporate behavioral tests and safety checks is the most productive early investment. CircleCI’s write-up on the evolution from MLOps to LLMOps discusses orchestration and governance considerations that are useful when planning automation: From MLOps to LLMOps.

Read more: Tailored AI Solutions – Learn why a one-size-fits-all approach fails for enterprise LLM projects and how to design tailored solutions.

Emerging trends and tooling

The LLMOps ecosystem is maturing fast. Expect developments in:

  • Prompt stores and version control: Tools to store, diff, and roll back prompts and injection patterns.
  • Behavioral testing frameworks: Suites that test for hallucinations, bias, toxicity, and alignment drift.
  • Model orchestration platforms: Systems that select models dynamically based on cost, latency, and requested capability.
  • Hybrid hosting options: More flexible choices between cloud-hosted models and on-prem/self-hosted deployments for compliance-sensitive workloads.

Google Cloud’s material on LLMOps emphasizes real-time performance monitoring and data management, both of which are increasingly important as LLMs move into live user-facing systems: Real-time LLMOps guidance.

Read more: AI Development Services – Find practical services and consulting approaches to implement responsible AI and LLM projects.

Best practices checklist

  • Version prompts, embeddings, and retrieval indexes alongside code and models.
  • Use RAG to ground responses and reduce hallucinations before committing to fine-tuning.
  • Instrument behavioral metrics (hallucination rate, toxicity, customer satisfaction) and tie them into alerting.
  • Implement gradual rollouts and canaries for prompt and model changes.
  • Include human review for high-risk outputs and maintain audit logs for compliance.
  • Optimize serving architecture for cost and latency: caching, sharding, and mixed-model strategies.
Read more: Data Engineering Services – Explore how building resilient data pipelines supports accurate retrieval and fine-tuning for LLMs.

FAQ

What does LLMOps stand for?

LLMOps means Large Language Model Operations. It refers to practices, tooling, and processes for deploying and managing LLMs in production.

What is the difference between LLMOps and MLOps?

LLMOps extends MLOps to cover prompt management, retrieval augmentation, behavioral monitoring, and governance tailored for large language models.

What are the key aspects of LLMOps?

Key aspects include prompt versioning, RAG data curation, lifecycle automation, cost and latency optimization, and safety/governance frameworks.

What is the life cycle of LLMOps?

The LLMOps lifecycle spans discovery, prototyping, fine-tuning or retrieval design, deployment, monitoring, and governance with automation at each step.

What are the best practices for LLMOps?

Best practices include versioning prompts, using RAG, monitoring behavioral metrics, canary rollouts, human review for risky outputs, and cost-aware serving.

Closing thoughts

LLMOps is not a buzzword — it’s a pragmatic evolution that recognizes LLMs are different beasts than traditional models. Investing in LLMOps practices early will make your LLM projects more reliable, safer, and more cost-effective. Start with strong data pipelines, versioned prompts, RAG strategies, and behavioral monitoring; then iterate toward automation and governance. If you’re building business systems with LLMs, LLMOps is the discipline that turns experimental demos into dependable products.

For teams ready to go beyond experimentation, combining solid data engineering, responsible AI development practices, and cloud-native infrastructure will accelerate success. If you want help designing that roadmap, Branch Boston offers services that cover data engineering, AI development, and cloud solutions tailored to enterprise needs.

datahealthmonitoring-image-blog

What Data Observability Is (and How It Prevents Data Disasters)

Data observability is the practice of understanding the internal health of your data systems by monitoring their signals — think of it as the health tracker for your data pipelines. It matters because as businesses scale, small data issues become big business headaches: wrong reports, broken ML models, and decisions based on garbage. In this article you’ll learn what data observability actually means, the practical pillars teams rely on, how to implement it without sending your engineers into alert-fatigue, and how it protects you from full-on data disasters.

What is data observability?

At its core, data observability is about turning signals from your data ecosystem into meaningful insights. Rather than reacting when someone spots a bad dashboard, observability helps you detect anomalies, trace problems to their root cause, and recover faster. It’s closely related to monitoring, but broader — focusing on the health of data as a product (completeness, freshness, distribution, volume, and lineage) rather than just system uptime. For a good overview of the concept and its pillars, see the primer from IBM on data observability.

Observability borrows ideas from software observability (metrics, logs, traces) and applies them specifically to data: telemetry about tables, pipelines, schemas, and model inputs. That’s why engineering, analytics, and product teams often collaborate closely when building observability into the data stack. If you want the deep-dive on pillars and lineage, Splunk’s guide is a useful read: Splunk on data observability.

Why data observability matters — and what’s at risk

Imagine a pricing algorithm that suddenly gets stale input data, or a marketing dashboard using an incomplete customer table. Those aren’t theoretical problems — they impact revenue, trust, and operational speed. Data observability helps you catch signs of data sickness early: increased nulls, skewed distributions, missing daily loads, or unexpected schema changes.

When observability is absent, teams spend a lot of time firefighting: chasing where an error started, validating assumptions, or rolling back models. With observability, incident detection, diagnosis, and resolution become proactive and measured — reducing time-to-repair and preventing knock-on issues. IBM explains how observability supports incident diagnosis and system health monitoring, which is central to preventing serious outages: IBM’s explanation.

💡 Tip: Start by defining the most business-critical datasets and model inputs. Observability is expensive to instrument everywhere — prioritize the pipelines that would cause real harm if they failed.

The pillars (and a practical way to think about them)

Different vendors and thought leaders phrase pillars differently — some list five, some four — but they converge on the same practical needs. Monte Carlo and other modern analyses emphasize pillars like freshness, volume, distribution, schema, and lineage. Here’s a practical breakdown you can use when planning:

  • Freshness and availability: Is the data arriving on time? Missing daily loads or delays are often the first sign of trouble.
  • Quality and distribution: Are values within expected ranges? Are nulls or outliers spiking?
  • Volume and cardinality: Sudden drops or surges in row counts or unique keys often indicate upstream failures or logic bugs.
  • Schema and structure: Are new columns appearing or types changing unexpectedly?
  • Lineage and traceability: Can you follow a faulty record back through the pipeline to the source system?

Splunk outlines how lineage and real-time monitoring together enable faster root-cause analysis and predictive detection: Splunk’s guide. Monte Carlo also emphasizes AI-powered anomaly detection and automated root-cause analysis as emerging best practices: Monte Carlo’s perspective.

How data observability works — in plain engineering terms

Implementing observability is a mix of instrumentation, automation, and team processes.

  1. Instrument your sources: Emit metrics for pipeline runs, table row counts, schema hashes, and load durations. These are your raw signals.
  2. Collect telemetry: Aggregate logs, metrics, and record-level metadata into a central place so you can correlate signals across systems.
  3. Detect anomalies: Use rule-based checks and machine learning models to flag deviations from expected behavior.
  4. Trace lineage: Map how data moves through ETL jobs, transformations, and downstream models so you can follow an issue to its origin.
  5. Automate alerts and runbooks: Send actionable alerts with context (what changed, recent runs, sample bad records) and link to runbooks for triage.
  6. Feedback loop: Capture incident outcomes to refine checks and reduce false positives over time.

For how observability supports disaster recovery through metrics, logs, and traces, see this practical explanation from Milvus: Milvus on disaster recovery.

Read more: Data Engineering for AI – Reliable data pipelines are the foundation for effective observability and trustworthy AI outcomes.

Strategies to prevent data disasters (step-by-step)

Preventing data disasters is less about expensive tools and more about smart priorities and repeatable practices. Here’s a pragmatic roadmap your team can use:

  • Inventory and classification: Know what datasets you have, where they’re used, and which are business-critical.
  • Implement lightweight checks: Start with row counts, null rates, and freshness checks on critical tables. Expand later.
  • Establish lineage: Use metadata tools to map dependencies so you can answer “what will break if this table fails?” quickly.
  • Contextual alerts: Send alerts that include recent metrics, sample records, and links to dashboards and runbooks.
  • On-call practices: Rotate ownership, document runbooks, and review incidents to prevent recurrence.
  • Use ML where it helps: Anomaly detection can reduce noise by prioritizing the most suspicious deviations, but start with deterministic checks before layering ML.
💡 Tip: Don’t try to observe everything on day one. Instrument the top 10% of datasets that drive 90% of decisions — it delivers the biggest risk reduction for the least effort.
Read more: Tailored AI Solutions – Observability ensures the high-quality data that AI systems need for accurate predictions and safe automation.

Common challenges and how to overcome them

Teams run into a handful of repeatable obstacles when building observability:

  • Alert fatigue: Too many noisy checks create false alarms. Fix by tuning thresholds, batching similar anomalies, and prioritizing critical datasets.
  • Blind spots in lineage: Without accurate lineage, root-cause analysis stalls. Invest in metadata capture and automated lineage tracing where possible.
  • Ownership ambiguity: If no one owns a dataset, it’s unlikely to be observed well. Assign data owners and make SLAs explicit.
  • Tool sprawl: Multiple monitoring tools with fragmented signals slow diagnosis. Consolidate telemetry or integrate tools to provide a single pane of view.

Collibra’s take on maintaining data system health stresses monitoring, tracking, and proactive troubleshooting as key activities — essentially the antidote to these challenges: Collibra on defining data observability.

Read more: Data Engineering Services – Strong engineering practices make observability easier by standardizing pipelines and data contracts.

Tools and automation — what to look for

The market has specialized observability platforms, pipeline-focused tools, and general-purpose monitoring systems. When evaluating tools, prioritize:

  • Automated lineage and easy integration with your data stack.
  • Flexible rules and built-in anomaly detection (with explainability).
  • Actionable alert context (sample bad records, diffs, and recent job runs).
  • Good metadata management and collaboration features so analysts and engineers can share context.

Monte Carlo and Splunk both highlight automation and predictive analytics as growing trends; automation reduces mean-time-to-detect and mean-time-to-repair, and predictive signals help avoid incidents before they escalate: Monte Carlo and Splunk.

Read more: Cloud Cost Strategies – Observability helps control cloud costs by spotting inefficiencies in pipelines and storage early.

Trends to watch

Watch for these evolving trends in data observability:

  • AI-assisted root cause analysis: Tools are getting better at suggesting the most probable causes and the minimal set of failing components.
  • Record-level lineage: Tracing not just tables but individual records through transformations is becoming more feasible and valuable for debugging.
  • Observability-as-code: Defining checks, alerts, and SLAs in version-controlled pipelines to keep observability reproducible and auditable.
  • Cross-team SLAs: Product, analytics, and engineering teams formalize dataset contracts so ownership is clear and expectations are aligned.

FAQ

What is meant by data observability?

Data observability is the practice of collecting telemetry (metrics, logs, metadata) from pipelines and systems to monitor health, detect anomalies, trace lineage, and resolve issues quickly. It treats data as a product with a focus on availability, quality, and traceability. IBM on data observability

What are the 4 pillars of data observability?

Common pillars include freshness, distribution (quality), volume, and schema. Many frameworks add lineage as a fifth pillar for tracing the origin of issues. Splunk’s pillars

What are the use cases of data observability?

Use cases include early detection of ingestion failures, preventing bad data from reaching dashboards, faster root-cause analysis, automated alerting, and improved confidence in ML outputs. It also supports disaster recovery. Milvus on disaster recovery

What is the difference between data observability and data monitoring?

Monitoring uses predefined checks and dashboards to confirm uptime or thresholds. Observability is broader: it leverages signals (metrics, logs, metadata) to understand behavior and diagnose new, unseen issues without extra instrumentation.

How does data observability work?

It works by instrumenting data flows to emit telemetry (counts, schemas, runtimes), collecting it centrally, applying anomaly detection, and mapping lineage for traceability. Alerts and runbooks speed resolution. Tools like Monte Carlo and Collibra provide practical implementations.

💡 Tip: Pair observability with documented runbooks and incident reviews. Tools show what broke; runbooks explain what to do next and how to prevent repeat issues.

Closing thoughts

Data observability isn’t a magic wand, but it’s one of the highest-leverage investments a data-driven organization can make. It reduces downtime, protects revenue and reputation, and returns time to engineers and analysts who would otherwise be stuck in perpetual triage. Start small, focus on critical datasets, and build processes around the signals your systems provide — you’ll avoid data disasters and sleep a little easier at night.

Read more: Technology Services Overview – A broad look at how technology services, including observability, strengthen resilience and reliability.
dataorchestration-image-blog

Apache Airflow vs Prefect vs Dagster: Modern Data Orchestration Compared

Data orchestration is the invisible conductor that keeps data pipelines playing in harmony — and choosing the right conductor matters. Whether you’re running nightly ETL, powering ML feature stores, or wiring data for real-time analytics, the orchestrator you pick affects developer productivity, reliability, and long-term maintenance. In this article we’ll compare Apache Airflow, Prefect, and Dagster across design philosophies, developer experience, scheduling and execution models, observability, and real-world fit. By the end you’ll have practical guidance on which tool to try first and what to watch for during adoption.

Why data orchestration matters

Orchestration does more than kick off jobs at specific times. It manages dependencies, retries failures intelligently, coordinates across systems, and feeds observability into the teams that run it. As organizations scale, orchestration becomes the spine of reliable data delivery — one wrong scheduling quirk can delay reports, break models, or cause production outages.

💡 Tip: Don’t treat an orchestrator as just a scheduler. Evaluate how it surfaces metadata (who ran what, with which inputs), how it supports versioning, and how easy it is to test locally before deploying to production.

Quick primer: What each tool brings to the table

  • Apache Airflow — Mature, battle-tested, and community-backed. Airflow excels at complex static DAGs, deep integration with diverse systems, and proven production deployments. It’s a safe default for heavy scheduling needs, though it can feel heavyweight for dynamic or asset-centric workflows.
  • Prefect — Modern, cloud-friendly, and API-driven. Prefect emphasizes dynamic flows, hybrid execution, and runtime control (think circuit-breakers and real-time SLA alerting). It often delivers faster developer iteration for cloud-native teams and supports both local and managed control planes.
  • Dagster — Developer-first and asset-aware. Dagster treats pipelines as versioned assets and focuses on strong typing, local development ergonomics, and observability for metadata. It’s a strong contender for ML pipelines and teams who want explicit tracking of data assets rather than just tasks.

These summaries align with recent comparisons that highlight Airflow’s stability, Prefect’s dynamic execution model, and Dagster’s asset-based approach (see the risingwave comparison and the getgalaxy guide).

Key differences that affect day-to-day work

1) Static DAGs vs dynamic flows vs assets

Airflow centers on DAGs defined as code — great for predictable, repeatable jobs. Prefect gives you dynamic flows where runtime decisions, mapping, and stateful control are easier. Dagster reframes pipelines around assets, which is useful when you care about the lineage and versioning of datasets and model artifacts rather than just task success.

2) Developer experience and testing

Dagster emphasizes local development and testability with a tight feedback loop, while Prefect’s Pythonic API and interactive REPL-style debugging make iteration quick. Airflow historically required more CI and operational scaffolding for testing, though newer patterns and plugins have improved the local dev story.

💡 Tip: Try a small PoC pipeline end-to-end: local authoring, unit tests, deployment, and an intentional failure. The tool that surfaces fixes fastest is often the team’s best friend.

3) Scheduling, execution, and scaling

Airflow is strong on cron-like scheduling, backfills, and complex dependency windows. Prefect supports hybrid execution models so sensitive tasks can run on-prem while the control plane is hosted. Dagster focuses on sensible parallelism around assets and can scale with Kubernetes executors. If your use case includes heavy real-time or very high concurrency workloads, verify the execution model under load.

4) Observability and metadata

Observability is where preferences diverge. Airflow provides mature UI and logging, but teams often augment it with external monitoring. Dagster builds metadata and lineage into its core, making it easier to answer “which dataset changed?” Prefect provides runtime introspection and SLA alerting, which is handy for detecting anomalies during execution (see the practical comparisons in the zenml showdown).

When to choose each orchestrator

  • Choose Airflow if you have many existing integrations, need complex time-based scheduling, or require a mature ecosystem for enterprise use. Airflow is the conservative, reliable choice for production-grade DAGs.
  • Choose Prefect if you want an API-driven, cloud-friendly orchestrator that supports dynamic flows and hybrid execution. It’s great for teams building modern pipelines that need runtime control and simple orchestration for cloud services.
  • Choose Dagster if you’re building ML pipelines, care deeply about asset lineage and versioning, and want a pleasant developer experience with strong local testing and typed IO.
Read more: Data Engineering AI – explains how solid pipelines and orchestration are foundational for AI and ML projects.

Migration and hybrid strategies

Moving orchestrators isn’t trivial, but it’s doable with a balanced approach. Consider running both systems in parallel during a migration — keep critical DAGs in the stable orchestrator while gradually porting pipelines to the new system. Focus first on idempotent tasks and data assets that have clear inputs and outputs. Use adapters or small wrapper operators to maintain compatibility with external systems during transition.

Read more: Data Engineering Services – practical help for building resilient pipelines and orchestrations when migrating or scaling.

Costs, ops, and ecosystem

Open-source and cloud-managed offerings change the total cost of ownership. Airflow distributions (Apache Airflow, Astronomer, Managed Airflow) and community operators give diverse deployment options. Prefect offers a managed cloud control plane plus an open-source core, while Dagster also has a hosted option and an opinionated open-source framework. Consider the operational skillset on your team and whether hosting, managed control planes, or vendor support match your compliance posture.

Common challenges and how to manage them

  1. Dependency sprawl: Large DAGs or complex asset graphs can become brittle. Break DAGs into smaller, testable units and prefer explicit asset definitions when possible.
  2. Observability gaps: Missing metadata makes debugging slow. Standardize logging, add lineage capture, and wire orchestration alerts into your incident channels.
  3. Testing pipelines: Write unit tests for task logic and integration tests for orchestration behavior. Leverage local execution modes provided by Prefect and Dagster to iterate quickly.
  4. Team buy-in: Migration is as much cultural as technical. Run brown-bag sessions, document patterns, and create starter templates for common pipeline types.
Read more: Cloud Infrastructure – guidance on choosing cloud-hosting and security models that interplay with orchestrator choices.

Trends to watch

  • Asset-first orchestration is growing, especially for ML and analytics teams that need lineage and dataset versioning.
  • Hybrid execution and zero-trust designs will shape how teams run sensitive tasks on-prem while using cloud control planes for coordination.
  • Stronger developer ergonomics and local testing support will tilt new projects toward tools that reduce friction in iteration cycles.

FAQ

What is data orchestration vs ETL?

Data orchestration is the coordination layer that manages when, where, and how data tasks run and how their outputs flow between systems. ETL (extract, transform, load) is a specific pattern of data movement and transformation. Orchestration manages ETL jobs along with other tasks like model training, monitoring, and downstream notifications — think of ETL as a cargo train and orchestration as the railroad network and timetable.

What is the difference between data orchestration and data integration?

Data integration focuses on combining data from different sources into a coherent target (for example, a data warehouse), often handling schema mapping and transformation. Orchestration focuses on scheduling, dependency management, retries, and the logic that runs those integration tasks. Integration is about the data; orchestration is about when and how integration jobs execute.

What is the best data orchestration tool?

There’s no one-size-fits-all best tool. Airflow is often best for complex, time-based production workflows; Prefect shines for cloud-native, dynamic flows; Dagster is excellent when asset lineage and developer ergonomics matter. The best choice depends on your team’s skills, operational constraints, and the nature of your pipelines — pilot each tool with a representative workload before committing.

What is an orchestration framework?

An orchestration framework is a software system that defines, schedules, and monitors workflows. It provides APIs or DSLs for authors to define tasks and dependencies, an execution engine to run work, and UIs or APIs to visualize runs and handle failures. Frameworks may be more opinionated (asset-first) or more general-purpose (task graphs).

What is a data orchestration example?

A common example: a nightly pipeline that extracts sales data from multiple sources, transforms and aggregates it, updates a reporting table in a data warehouse, triggers model retraining if data drift is detected, and alerts stakeholders when thresholds are crossed. The orchestrator manages ordering, retries, parallelism, and notifications across those steps.

streamvbatch-image-blog

What Stream Processing Really Is (and When to Use It Over Batch)

Think of stream processing as the live sports broadcast of data: it delivers plays as they happen, not after the final buzzer. This article explains what stream processing is, why it matters for modern businesses, and how to decide when to choose streaming over traditional batch processing. You’ll get practical patterns, trade-offs to watch for, and a short checklist to help you move from theory to action without pulling your hair out.

Why stream processing matters

Data used to arrive in neat piles — nightly ETL jobs, weekly reports, monthly reconciliations — and batch processing was the unquestioned hero. But businesses increasingly need immediate, continuous insight: fraud alarms the moment a transaction looks suspicious, product recommendations that update as a visitor browses, or sensor alerts from connected equipment. Stream processing turns incoming events into timely decisions, enabling lower latency, better customer experiences, and faster operational response.

For a concise primer on what stream processing entails, Confluent’s introduction is a clear, friendly resource that highlights real-time transformation and common use cases like fraud detection and recommendations.

Core concepts (the parts that make streaming feel like magic)

Here are the foundational ideas you’ll see again and again when working with streams:

  • Events and streams: A stream is an append-only sequence of events (user clicks, sensor readings, log lines). Processing happens continuously as events arrive.
  • Processing time vs event time: Processing time is when the system sees the event; event time is when the event actually happened. Handling late or out-of-order events requires thinking in event time.
  • Windowing: Windows group events into time-bounded sets (sliding, tumbling, session windows) so you can compute aggregates over meaningful intervals.
  • Stateful vs stateless: Some operations (simple transforms) are stateless; others (counts, joins, sessionization) require keeping state across events.
  • Delivery semantics: At-least-once, at-most-once, and exactly-once delivery affect correctness and complexity of downstream logic.
💡 Tip: If your use case needs counts or joins over time (e.g., active users in the last 5 minutes), you’ll almost always need windowing and stateful processing — that’s the sweet spot for stream processors.

When to use stream processing over batch

You don’t always need streaming. Batch is still the right tool for a lot of jobs. Use streaming when latency and continuous updates are core requirements. Here’s a practical decision guide:

  1. Latency matters: If decisions or user experiences depend on sub-second to minute-level freshness (fraud detection, live personalization, operational alerts), pick streaming.
  2. Continuous input: If data arrives continuously and you need ongoing computation rather than periodic snapshots, streaming fits better.
  3. Incremental computation: If you can maintain and update results as events come in rather than recomputing whole datasets, streaming is usually more efficient.
  4. Complex event patterns: Correlating patterns across events over time (like detecting sequences of suspicious actions) favors streaming.
  5. Downstream SLAs: If systems downstream expect near-real-time updates or push notifications, stream-first architectures simplify the flow.

For a side-by-side comparison, GeeksforGeeks provides a straightforward look at batch versus stream processing, including how to choose based on latency needs.

Read more: AI backbone insights – how solid data engineering underpins both batch and streaming architectures for AI systems.

Common streaming architecture patterns

There are a few patterns that keep showing up in real projects. Pick the pattern that best fits your operational constraints and team skills.

  • Event-driven microservices: Services react to streams of domain events. Good for decoupling and scalability.
  • Kappa-style architecture: Treat everything as a stream — even what you used to do in batch — simplifying the stack and avoiding sync between batch and streaming layers.
  • Streaming ETL: Ingest, transform, and route data in real time, then store final or aggregated results in databases or data lakes for serving and analytics.
  • Hybrid (batch + stream): Use streaming for time-sensitive, incremental updates and batch for heavy historical reprocessing or large-scale model training.

Splunk’s overview on stream processing does a great job of explaining how continuous ingestion and low-latency insight drive these architectures in fields like finance and IoT.

Read more: Cloud infrastructure services – because streaming systems often rely on scalable, resilient cloud infrastructure to handle bursts and stateful workloads.

Trade-offs and challenges (the not-so-fun but necessary bits)

Streaming brings power, but also complexity. Expect to trade simplicity for speed in several areas:

  • Operational complexity: Stateful processors, checkpointing, and managing exactly-once semantics require more operational thought than simple batch jobs.
  • Testing and debugging: Reproducing errors in a continuously running system can be trickier than replaying a batch job.
  • Cost model: Continuous compute and storage for state can be more expensive than periodic batch runs — but the business value often justifies it.
  • Data correctness: Handling late-arriving or out-of-order events and ensuring idempotent updates take careful design.
💡 Tip: Invest in observability from day one. Tracing, metrics, and replayable logs (like Kafka topics) make bugs easier to find and fixes safer.

Implementation checklist — practical steps to get started

Here’s a short checklist to move from “we should do streaming” to “we’re reliably running streams in production.”

  1. Define business SLAs: What freshness and correctness guarantees do you need? This controls technology and architecture choices.
  2. Model events: Design clear, versioned event schemas and plan for schema evolution.
  3. Choose your processing model: Stateless transforms vs stateful windowed computations — choose frameworks that support your needs.
  4. Plan for delivery semantics: Decide whether at-least-once is acceptable or if you need exactly-once processing and pick tooling that supports it.
  5. Build observability: Expose metrics, tracing, and retention policies; keep logs replayable so you can reprocess historical data.
  6. Test with production-like data: Simulate out-of-order and late events, run chaos tests for backpressure and failures.
  7. Deploy with CI/CD: Automate deployments and include migration/rollback plans for stateful processors.
Read more: CI/CD & DevOps – best practices for automating delivery and safely rolling out streaming processors and pipelines.

When batch still wins

Batch processing isn’t dead. It’s efficient and simpler for many workloads:

  • Large-scale historical analytics, machine learning training on full datasets, and periodic reporting are great batch candidates.
  • If your business is okay with hourly or daily freshness, batch reduces complexity and cost.
  • Use batch when reproducibility (rebuilding everything exactly from raw data) and peak cost efficiency are primary goals.

GeeksforGeeks provides a helpful side-by-side view so you can map your specific needs to the right approach.

Trends and what’s next

Streaming is moving from niche to mainstream. Key trends to watch:

  • Cloud-native streaming: Managed platforms reduce operational burden and make streaming accessible to teams without deep ops expertise.
  • Convergence of analytics and operational systems: Real-time ML inference and feature updates mean streaming is increasingly part of ML workflows.
  • Better developer ergonomics: Higher-level stream SQL and stream-first frameworks let product teams work faster without sacrificing correctness.

Redpanda’s fundamentals guide and Splunk’s blog both emphasize that real-time insights and operational responsiveness are central to modern businesses’ competitive advantage.

FAQ

What do you mean by stream processing?

Stream processing is the continuous ingestion, transformation, and analysis of data as events arrive, rather than waiting for a complete dataset. It enables low-latency computations like rolling aggregates, pattern detection, and real-time transformations so systems can act on data immediately.

Why is stream processing important?

Many modern business problems require immediate action or continuous updating: fraud prevention, live personalization, and operational monitoring. Stream processing reduces decision latency and can provide near-instant insights that batch systems can’t deliver in time.

Is stream processing real-time?

“Real-time” can mean different things depending on context. Stream processing enables near-real-time or real-time behaviors (sub-second to seconds latency), but actual latency depends on system design, infrastructure, and processing complexity. For details on common use cases and latency considerations, Confluent’s primer is a good practical resource.

How is stream processing different from traditional data processing?

Traditional (batch) processing collects data over a period, then processes it in bulk. Stream processing handles data continuously as it arrives. The difference shows up in latency, architecture complexity, state management, and cost profiles. Batch is easier to reason about and cheaper for infrequent jobs; streaming is necessary when timeliness and incremental updates matter.

What is the difference between batch and streaming dataflow?

Batch dataflow handles bounded sets of data with clear start and end times, whereas streaming dataflow processes unbounded, continuously growing datasets. Stream processing emphasizes windowing, event-time semantics, and incremental state updates; batch workflows focus on bulk operations, full recomputation, and scheduled runs.