cloudstorage-image-blog

AWS S3 vs Azure Blob Storage vs Google Cloud Storage for Data Lakes

Choosing storage for a data lake feels a bit like picking a city to move to: you want scalability, good neighborhood integrations, reasonable taxes (a.k.a. cost), and a sense that your stuff won’t vanish overnight. In cloud terms, that decision usually comes down to Amazon S3, Azure Blob Storage, or Google Cloud Storage. Each has strengths for different data lake patterns, analytics workflows, and team skills. In this article you’ll get a practical comparison across architecture, performance, pricing patterns, security, and real-world trade-offs so you can pick the best fit for your next data lake.

Why object storage is the default for data lakes

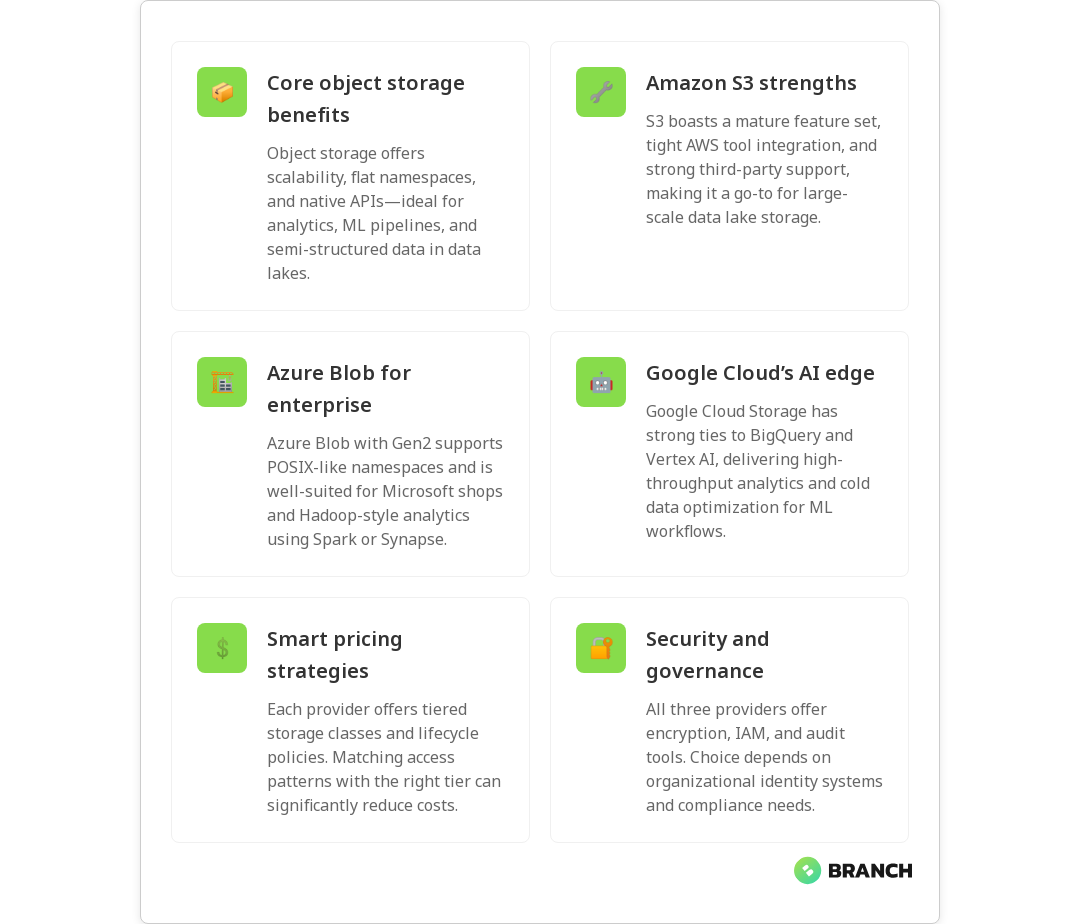
Modern data lakes are built on object storage because it can store massive amounts of unstructured and semi-structured data cheaply and reliably. Object stores provide flat namespaces, immutability options, lifecycle policies, and native APIs that work well with analytics engines, ETL pipelines, and machine learning systems.

All three major providers—Amazon S3, Azure Blob Storage, and Google Cloud Storage—are designed for high durability and availability and integrate tightly with their cloud ecosystems. If you want to compare vendor docs directly, see the product pages for Amazon S3, Azure Blob Storage pricing, and Google Cloud Storage.

Core differences at a glance

  • Amazon S3 – Mature feature set, unparalleled ecosystem integration with AWS analytics tools, broad third-party support, and advanced object-level features (versioning, replication, lifecycle rules).
  • Azure Blob Storage – Strong integration with Azure analytics (including Data Lake Storage Gen2 capabilities), hierarchical namespace option for POSIX-like behavior, and pricing tiers tuned for enterprise patterns.
  • Google Cloud Storage – Seamless integration with BigQuery and Vertex AI, storage classes optimized for long-tail and cold data, and excellent performance for analytics workloads.
💡 Tip: If your analytics stack is already tied to one ecosystem (e.g., BigQuery, Athena, Synapse), choose the storage service that integrates natively to avoid egress costs and save time.

Scalability, durability, and consistency

All three platforms promise very high durability (typically 11 nines in S3 terms or equivalent) and scale virtually without limits. Where they differ is consistency and performance characteristics:

  • S3: Strong read-after-write consistency for PUTs of new objects and eventual consistency for overwrite/delete in older timeframes, but AWS has improved consistency guarantees across regions and operations. Its worldwide adoption means many analytical tools have tuned connectors for S3.
  • Azure Blob (with Data Lake Gen2): Offers a hierarchical namespace which can behave more like a file system—this helps directories, renames, and small-file handling common in Hadoop-style workloads. Consistency is strong for most operations within a storage account.
  • Google Cloud Storage: Provides strong global consistency and is optimized for high-throughput analytics, often pairing nicely with BigQuery for serverless analytics over large datasets.

Data lake features and analytics integrations

The real power of object storage for data lakes is how it integrates with compute and analytics services.

  • Amazon S3 integrates with AWS analytics (Glue, Athena, Redshift Spectrum, EMR) and many third-party tools. S3’s vast feature set includes selective replication (cross-region replication), object locking for immutability, and event notifications to trigger pipelines.
  • Azure Blob + Data Lake Storage Gen2 targets big data workloads with a hierarchical namespace, making it friendly for Hadoop, Spark, and ADLS-native tools. It’s commonly used with Azure Synapse, Databricks on Azure, and Azure Data Factory.
  • Google Cloud Storage is built to work smoothly with BigQuery, Dataproc, and Vertex AI. If your roadmap includes heavy use of BigQuery or Vertex AI for ML, GCS often feels like the path of least resistance.
Read more: AI Solutions Backbone – why robust data foundations are essential for analytics and ML.

Pricing patterns and cost control

Pricing is complex: object storage costs include storage per GB, request costs, data retrieval (for cool/archival tiers), and data egress. Each provider offers tiers that let you trade cost for access speed.

  • AWS S3 – Multiple storage classes (Standard, Intelligent-Tiering, Standard-IA, Glacier) and pricing options. S3 Intelligent-Tiering can help manage unknown access patterns automatically.
  • Azure Blob – Hot, Cool, and Archive tiers and Reserved Capacity options to lower storage costs for predictable needs. Azure’s tiering and lifecycle policies work well with Gen2 for analytics cost control; see the Azure Blob Storage pricing page for details.
  • Google Cloud Storage – Standard, Nearline, Coldline, Archive tiers and seamless integration with long-term analytics; Google often markets lower costs for cold storage classes and strong network pricing for some patterns. Check the Google Cloud Storage page for the latest class descriptions.
💡 Tip: Track access patterns early and use lifecycle policies to automatically move rarely used data into colder tiers — huge savings with minimal effort.
Read more: Cloud Cost Strategies – practical techniques to control cloud spend across storage and compute.

Security, governance, and compliance

Security is table stakes. Each provider supports encryption at rest and in transit, role-based access, and logging. Differences emerge in tooling and integrations for governance:

  • IAM and policies: AWS IAM is granular and mature; Azure uses role-based access control (RBAC) integrated with Active Directory; Google Cloud IAM also offers fine-grained controls and organization policies.
  • Data governance: If you need enterprise governance frameworks, consider the provider whose ecosystem matches your identity and compliance needs (e.g., Azure for heavy Microsoft shops, AWS for broad third-party integrations).
  • Auditing and data protection: All three support logging, object immutability, and encryption keys (including customer-managed keys).
Read more: Azure Cloud Services – when to favor Azure for secure, enterprise-grade implementations.

Operational considerations and migrations

Operational realities often decide the winner more than theoretical benchmarks. Consider the following:

  1. Data transfer and egress: Moving petabytes between clouds is expensive. Plan initial ingress strategies (direct transfer appliances, edge ingest) and avoid unnecessary cross-cloud egress.
  2. Tooling and talent: Teams familiar with AWS will likely be more productive on S3; Azure-centric shops benefit from Blob + Gen2; Google-first data science teams often prefer GCS + BigQuery.
  3. Third-party ecosystem: S3 has the broadest third-party tool support, but Azure and GCS are catching up quickly with vendor integrations and managed services.
💡 Tip: Always prototype with a small dataset before full migration. Test ingestion speed, lifecycle rules, and query performance to uncover surprises early.
Read more: Cloud Infrastructure Services – guidance on building scalable, secure cloud storage and networking for data workloads.

Multi-cloud and hybrid scenarios

If you need multi-cloud redundancy or a hybrid footprint, evaluate cross-cloud toolchains and metadata layers like LakeFS, Delta Lake, or Apache Iceberg to provide consistent semantics across stores. Each provider offers interoperability guidance—see Google’s comparison of AWS, Azure, and GCP services for mapping and migration considerations at GCP’s service comparison.

How to choose: decision checklist

  • Is your analytics stack tied to one cloud (BigQuery, Redshift, Synapse)? Prefer the native provider.
  • Do you need a hierarchical namespace for many small files? Consider Azure Data Lake Gen2.
  • Are third-party tools and wide marketplace support critical? Amazon S3 remains the broadest choice.
  • Do you expect heavy ML usage with Vertex AI or managed notebooks? Google Cloud Storage pairs well with those.
  • How predictable are your storage costs? Explore reserved capacity and lifecycle policies on Azure and tiering options across providers to lower bills.
Read more: Technology Services – a vendor-agnostic view on matching architecture to business goals.

FAQ

Which is the best cloud storage?

There’s no single “best”—it depends on needs. Amazon S3 is often the safest choice for broad compatibility and mature features. Azure Blob (especially with Data Lake Gen2) is great for enterprise Microsoft shops and Hadoop-style workloads. Google Cloud Storage is ideal when you want tight integration with BigQuery and Vertex AI. Match the storage to your analytics stack, access patterns, and team skills.

What is the cost of 1TB cloud storage?

Costs vary by provider, tier, and region. Roughly speaking, hot/standard object storage might range from a few dollars to $25+ per month per TB depending on provider and tier, while colder tiers can be much cheaper (but charge for retrieval). Always check current pricing pages (for example, Azure’s Blob pricing) and model request and egress costs for your workload. See our Cloud Cost Optimization services for ways to keep bills under control.

Is cloud storage worth paying for?

Yes for most businesses. Cloud storage removes upfront hardware costs, gives near-infinite scalability, provides reliability, and offloads maintenance. For many teams the operational benefits—elasticity, integrated services, and managed durability—outweigh the monthly bill, especially when optimized with lifecycle rules and right-sized tiers. Our Cloud Infrastructure Services can help you implement best practices.

Which cloud storage is free?

No major provider offers large-scale object storage for free. Many provide limited free tiers or trial credits for new users, and there are free tiers for specific services (e.g., a few GBs of storage). For real-world data lakes, you should budget for paid storage and factor in lifecycle and access costs.

Is Google Drive a cloud storage?

Yes—Google Drive is a consumer-focused cloud storage product built for file syncing and collaboration, not for data lakes. It’s great for documents and small team files but lacks the scale, APIs, durability guarantees, and analytics integrations required for large-scale data lake architectures. For analytics workloads, choose an object store like Google Cloud Storage. Learn more in our Data Engineering Services.

Final thoughts

Picking between Amazon S3, Azure Blob Storage, and Google Cloud Storage is less about declaring a winner and more about matching platform strengths to your business, tooling, and cost profile. Prototype, measure, and plan lifecycle policies up front. If you need help making that architecture decision or executing a migration, Branch Boston’s teams can help design a secure, cost-effective data lake strategy that aligns with your analytics and AI goals.

Read more: Data Engineering Services – how expert data engineering helps build reliable data lakes and pipelines.
datameshfabric-image-blog

What Data Fabric Really Is (and How It Differs from Data Mesh)

Data architecture terms have a way of multiplying like rabbits at a tech conference: data lakehouse, data warehouse, data mesh, data fabric… it’s a lot. If you’ve ever wondered whether “data fabric” is a buzzword or a practical approach that will actually make your life easier, you’re in the right place. This article explains what a data fabric is, how it works, and how it differs from data mesh — plus when you might want one, the other, or both. You’ll walk away with a clear mental model and practical next steps for your organization.

What is data fabric?

At its core, a data fabric is an architectural approach and set of technologies designed to make data available, discoverable, and usable across an organization’s hybrid environment — without moving everything into one monolithic store. Think of it like the fabric in a smart wardrobe: it stitches together disparate data sources, provides metadata-driven context, and offers unified access patterns so applications and analysts find the data they need quickly.

Rather than being a single product you install, data fabric is a layered solution that uses metadata management, data virtualization, catalogs, lineage, and automation to present a logical, connected view of data. Vendors and consultants often package pieces of this, but the idea is consistent: reduce friction and increase trust with an intelligent integration layer.

For a practical overview of how data fabric fits among other modern architectures, see IBM’s comparison of lakehouse, fabric, and mesh.

IBM overview

Key components of a data fabric

  • Metadata-driven intelligence: Metadata is the fabric’s thread — catalogs, semantic tags, business glossaries, and automated classification create the context that makes data usable.
  • Data virtualization: Present data from many sources through a unified API or layer so consumers can query it without physically copying it into a single store.
  • Automated data integration: Pipelines, change-data-capture, and smart connectors to keep the fabric aware of updates across systems.
  • Governance & lineage: Built-in policies, auditing, and lineage tracking so analysts can trust the data and auditors can sleep peacefully.
  • Discovery and marketplaces: Catalogs and data marketplaces let users find, understand, and request access to datasets.

Alation’s practical guide to what a data fabric is offers a good primer on how catalogs and governance fit into this picture.

Alation guide

What is data mesh — a quick companion primer

While data fabric emphasizes a technology-led integration layer, data mesh focuses on organizational change. Data mesh proposes domain ownership of data: teams that understand a product or business domain own the datasets as products. Its core principles are domain-oriented data ownership, data as a product, self-serve data platforms, and federated governance. The goal is to reduce bottlenecks at centralized teams and enable scale through clear responsibilities.

Data mesh is more about people and processes; data fabric is more about plumbing and automation. But — and this is important — they are not mutually exclusive. Many organizations blend technical fabrics with mesh-inspired governance to get the best of both worlds. Booz Allen has a thoughtful discussion about using both approaches together.

Booz Allen article

How data fabric and data mesh differ (and where they overlap)

  • Primary focus: Data fabric = integration and metadata-driven access. Data mesh = organizational design and domain ownership.
  • Governance style: Fabric often leans toward centralized enforcement of policies via platform capabilities; mesh favors federated governance with domain-defined standards.
  • Implementation path: Fabric implementations typically start by cataloging and virtualizing data, while mesh often begins with piloting domain data products and scaling autonomous teams.
  • Speed vs. autonomy: Fabric can speed cross-team access quickly by reducing data movement; mesh gives domains autonomy and responsibility, which can increase ownership but requires cultural change.
  • Complementary strengths: A fabric can provide the technical substrate (catalog, lineage, security) that helps mesh domains operate reliably. Conversely, mesh practices make fabric-delivered data products more meaningful and trustworthy.

IBM’s deeper dive into augmented data management explains how a metadata-driven fabric can support hybrid environments and even accelerate a mesh adoption when paired with automation.

IBM on augmented data management

💡 Tip: If you’re starting out, inventory your pain points first. Are teams blocked because data is physically inaccessible, or because ownership and quality are inconsistent? If the former, begin with data fabric capabilities; if the latter, pilot a data mesh domain. Combining both often provides the most practical path forward.

When to choose data fabric, data mesh, or both

There’s no one-size-fits-all answer, but here are pragmatic guidelines:

  • Choose data fabric when: You need rapid, secure access to distributed data sources across cloud and on-prem systems, and you want to reduce data duplication. Fabric excels where integration and metadata consolidation are the biggest bottlenecks.
  • Choose data mesh when: Your organization is large, domains have specialized knowledge, and you want to scale ownership and responsibility. Mesh is about governance by domain and treating data as a product.
  • Choose both when: You need a robust technical layer to support decentralized teams. Fabric supplies the discovery, lineage, and access mechanisms that let mesh-aligned domains publish reliable data products efficiently.

Practical example: Imagine a retail company with separate teams for online sales, stores, and supply chain. A fabric can expose unified views of inventory and sales across systems. A mesh approach can let each domain own and maintain its dataset as a product (store sales dataset, online transactions dataset), while the fabric ensures those datasets are discoverable and accessible enterprise-wide.

Operational benefits of combining both: reduced time to insight, stronger data quality, clearer ownership, and a self-serve experience for analytics teams.

Common challenges and how to avoid them

  • Overcentralizing governance: If fabric teams try to control every detail, mesh benefits evaporate. Align governance around standards and guardrails, not micromanagement.
  • Poor metadata hygiene: Fabric depends on accurate metadata. Invest in cataloging, lineage, and automated metadata capture from day one.
  • Tool sprawl: Don’t bolt on too many point products. Choose platforms that integrate well and can automate routine tasks like discovery and lineage capture.
  • Organizational resistance: Data mesh requires cultural change. Start with pilot domains, provide clear incentives, and pair domain teams with platform engineers to reduce friction.

Trends to watch

  • Automation and AI for metadata: Automated tagging, classification, and semantic enrichment of datasets are maturing and will make fabrics smarter and easier to maintain.
  • Convergence of platforms: Expect platforms that combine cataloging, virtualization, governance, and pipeline automation — reducing integration overhead.
  • Focus on data products: The “data as a product” concept is gaining mainstream traction, which means fabrics will need to support strong SLAs and discoverability for curated datasets.
  • Hybrid-cloud support: As businesses keep operating across clouds and on-prem systems, fabrics that handle hybrid environments seamlessly will be strategic.

Note: Many consultancies and solution providers recommend a pragmatic mix. Datalere, for example, outlines how a unified architecture that leverages the strengths of both frameworks reduces duplication and improves collaboration across domains.

Datalere discussion

How this ties into practical work your team might already do

If your organization is building AI features, powering analytics, or building custom software that relies on trustworthy data, the foundations of a fabric — cataloging, lineage, access controls — are directly useful. Strong data engineering practices are essential for either fabric or mesh approaches. If you want to learn more about designing data infrastructure that powers AI, check out this deeper look at data engineering as the backbone of AI solutions.

Read more: AI Backbone Solutions – Learn how solid data engineering foundations make both data fabric and data mesh strategies successful.

Likewise, if you’re evaluating vendor support for data pipelines and governance, a clear data engineering services partner can accelerate building either fabric capabilities or a self-serve platform that supports mesh teams.

Read more: Data Engineering Services – See how expert partners can accelerate building data fabric capabilities or self-serve platforms for mesh teams.

If your roadmap includes AI pilots or retrieval-augmented generation (RAG) — where consistent, high-quality data is essential — tailoring AI solutions to your data strategy will be critical. Consider pairing data architecture decisions with tailored AI planning.

Read more: Tailored AI Solutions – Learn how aligning AI with your data architecture makes RAG and analytics more effective.

Finally, most fabrics run best on a resilient cloud infrastructure that supports hybrid connectivity, security, and performance tuning. If moving or integrating systems to the cloud is part of the plan, review cloud infrastructure options early.

Read more: Cloud Infrastructure Services – Build a resilient foundation for data fabrics and mesh platforms with secure, hybrid-ready cloud architecture.

FAQ

What is data fabric for dummies?

Data fabric is a smart layer that connects and organizes an organization’s data — across clouds, databases, and apps — so people and systems can find and use it without worrying about where it lives. It uses catalogs, metadata, and virtual access to present a unified view.

What is the difference between data fabric and data mesh?

Data fabric is a technology-led approach focused on integration, metadata, and unified access. Data mesh is an organizational model that decentralizes ownership and treats domain datasets as products. They complement each other when combined.

What is the difference between ETL and data fabric?

ETL (Extract, Transform, Load) is a process to move and transform data. Data fabric is a broader architecture that includes ETL alongside metadata management, virtualization, discovery, and governance to create an enterprise-wide data layer.

What is the difference between data lakehouse and data fabric?

A data lakehouse is a storage architecture that blends flexibility of data lakes with structured analytics of warehouses. A data fabric is an integration and access layer that sits on top of multiple storage systems — including lakehouses.

What are the advantages of data fabric?

Data fabric provides faster discovery, reduced duplication, unified governance, better support for hybrid environments, and improved self-serve analytics. When paired with clear ownership (via mesh practices), it accelerates trusted data use.

Ready to make data less of a guessing game? Whether you’re thinking about fabric, mesh, or a hybrid approach, the right combination of technology and organizational change will help you turn scattered data into reliable business outcomes — and free up your teams to do the interesting work, not the plumbing.

datadata-image-blog

What Data Mesh Governance Really Means (and How to Implement It)

Data mesh is more than a buzzy architecture trend — it’s a shift in how organizations treat data as a product owned by domains rather than a centralized IT silo. That shift brings huge benefits: faster insights, better scalability, and less bottleneck drama in your data pipelines. But none of that works without governance that fits the mesh model: lightweight, federated, and practical. In this article you’ll learn what data mesh governance actually is, the principles behind it, a step-by-step implementation approach, and tips for avoiding common pitfalls.

Why governance matters in a data mesh

Governance is often thought of as the party pooper at the data table — the rules person who says “you can’t.” In a data mesh, governance is instead the table that keeps everyone sitting together and passing the serving dishes. When governance is done right, it balances domain autonomy with company-wide standards for quality, discoverability, security, and compliance.

Traditional centralized governance fails in a mesh because it becomes a bottleneck. The workaround is federated governance: shared policies and guardrails combined with domain-level responsibility. ThoughtWorks lays out the idea of minimum viable governance capabilities and iterating governance as domains mature, which is a sensible, pragmatic way to avoid overgoverning from day one (see ThoughtWorks recommendations).

Core principles of data mesh governance

  • Federation over centralization: Policies are shared but enforcement and product ownership live with domains.
  • Data as a product: Each dataset is a product with owners, SLAs, documentation, and quality metrics.
  • Automate policy where possible: Policies should be code-first, enforceable, and monitored.
  • Metadata and discoverability: Strong metadata standards make data findable and trustworthy.
  • Minimal viable governance: Start with the smallest set of guardrails and expand as needed, rather than imposing a monolith of rules upfront.

These principles are echoed across several current guides and examples of data mesh governance. Practical implementations emphasize mandatory metadata, separation of platform capabilities from product governance, and monitoring to measure governance performance (see Data Mesh governance examples).

💡 Tip: Start with a “governance lite” checklist: ownership, required metadata fields, privacy tagging, and a basic SLA. Iterate after you see what breaks.

Practical steps to implement data mesh governance

1. Define roles and accountability

First, name the people. Decide who is the data product owner in each domain, who sits on the federated governance council, and who manages the platform capabilities. The council should include leaders from domain teams and platform engineers so policies are practical, not theoretical.

Read more: Data Engineering for AI – one short sentence on why it’s relevant here.

2. Establish minimal standards and metadata requirements

Agree on mandatory metadata (owner, description, schema, tags for sensitivity and retention, quality metrics). Use metadata as the contract between producers and consumers. The contract makes data discoverable and sets expectations for quality and support.

💡 Tip: Make completeness of essential metadata a gate for publishing a data product. That single rule prevents a lot of future grief.

3. Automate enforcement and observability

Where you can, codify governance rules as automated checks: schema validation, sensitive data scanning, access control enforcement, and lifecycle policy automation. Platform teams provide the tools, while domains use them. AWS and cloud providers often offer modular governance tools that can be integrated into a data mesh (see AWS Data Mesh guidance).

Read more: Tailored AI Solutions – one short sentence on why it’s relevant here.

4. Separate platform capabilities from product governance

The platform should deliver reusable capabilities — secure storage, tagging, policy engines, pipelines — but it should not own the data products’ decisions. ThoughtWorks recommends this separation to keep governance scalable and domain-focused.

5. Iterate governance with domain maturity

Not every domain will be ready for the same level of autonomy on day one. Implement minimum viable governance capabilities initially and increase complexity only as domains demonstrate readiness. Track governance performance and adapt policies based on real-world data (see ThoughtWorks recommendations for iterative scaling).

Read more: Data Engineering Services – one short sentence on why it’s relevant here.

Organizational and cultural shifts you’ll need

Shifting to data mesh governance is as much cultural as it is technical. Expect these changes:

  • Product thinking: Domain teams must treat data as a product with customers and SLAs.
  • Shared responsibility: Security, privacy, and quality are joint responsibilities, not a single team’s burden.
  • Collaboration rituals: Regular governance council meetings, shared playbooks, and cross-domain communities of practice.

Having a governance council that includes domain and platform representatives helps keep policies grounded in operational reality. Examples of successful governance groups include those that mandate metadata standards and enforce project/dataset isolation when needed (see Data Mesh governance examples).

Technology choices and platform controls

Platform design should enable governance without dictating product-level decisions. Key capabilities to build or buy include:

  • Metadata catalog and search
  • Policy-as-code engines for access control and data handling
  • Automated data quality checks and lineage tracking
  • Tag-based access control and sensitive data discovery

Cloud-native offerings often provide building blocks for these capabilities. AWS has guidance on integrating data mesh practices with cloud governance features that help with tagging and secure integration of third-party data (see AWS Data Mesh).

Read more: Cloud Infrastructure Services – one short sentence on why it’s relevant here.

Common challenges and how to overcome them

  1. Overgoverning vs. undergoverning: Start small with a minimal viable set of rules and expand them as you learn. Monitoring will tell you when to tighten or loosen controls.
  2. Tool sprawl: Standardize on a platform stack for common needs but allow domains to choose implementations for domain-specific concerns.
  3. Resistance to ownership: Incentivize product thinking by linking data product SLAs to team goals and providing clear, low-friction deployment paths.
  4. Security and privacy compliance: Treat compliance requirements as constraints the governance council encodes into platform policies and automations.

Case studies and practical write-ups emphasize the need for a federated governance model that balances central policy and domain execution — the sweet spot for innovation without chaos (see Mesh-AI case study and Dataversity article).

💡 Tip: Use a “policy impact score” to prioritize which rules to automate first — pick the ones that prevent the most common or costly mistakes.

Trends to watch

  • Policy-as-code frameworks: More organizations are making governance machine-readable and enforceable via CI/CD pipelines.
  • Governance dashboards and SLOs: Expect to see governance health tracked with SLOs and dedicated dashboards showing metadata coverage, access violations, and data quality trends.
  • Interoperability standards: Community-driven standards for metadata and product interfaces will reduce friction between domains.

Following industry guidance can accelerate your implementation. Dataversity and ThoughtWorks provide accessible perspectives on aligning decentralized architecture with central oversight for innovation and compliance (see Dataversity and ThoughtWorks recommendations).

Read more: AI Development Services – one short sentence on why it’s relevant here.

Putting it into practice: a simple roadmap

  1. Month 0–2: Assemble governance council, define minimal metadata and ownership rules, and select your platform capabilities.
  2. Month 2–6: Pilot with one or two domains, automate key checks (sensitivity scanning, schema validation), and measure product-level SLAs.
  3. Month 6–12: Expand federated governance, onboard more domains, refine policies based on usage data, and build dashboards for governance KPIs.
  4. Beyond 12 months: Mature into a continuous-evolution model: policies adapt, automation improves, and domains take increasing responsibility.

FAQ

What is meant by data governance?

Data governance is the set of processes, policies, roles, standards, and metrics that ensure effective and efficient use of data. In a data mesh, these responsibilities are federated across domains rather than centralized in one team.

What is the difference between data governance and data management?

Data management is the day-to-day operation of moving, storing, and processing data. Data governance defines the rules, roles, and policies that guide how data is managed and ensures it meets organizational requirements.

What are good data governance practices?

Best practices include clear ownership, standardized metadata, automated enforcement of policies, monitoring governance KPIs, and starting with a minimal viable governance approach that grows with domain maturity.

What are the three components of data governance?

Data governance typically consists of people (roles and responsibilities), processes (policies and workflows), and technology (tools and automation). In a mesh, these components are distributed and coordinated via a federated council.

What is a data governance framework?

A data governance framework defines the policies, standards, roles, and tools for managing and protecting data. In a data mesh, the framework emphasizes federation, metadata standards, and automation for scalable governance.

Read more: Custom Software Development – one short sentence on why it’s relevant here.
💡 Tip: Keep one governance doc that explains “why” and another that shows “how” (playbooks, templates, and policy-as-code). It keeps legalese separate from practical guidance.

Data mesh governance is not a single tool or a rigid rulebook — it’s a practice that evolves as your teams and data products evolve. Start with small, enforceable guardrails, automate what you can, and let domain teams take ownership while the platform provides the rails. For practical examples and recommendations, see ThoughtWorks’ implementation guide and other contemporary case studies on federated governance (ThoughtWorks recommendations, Mesh-AI case study, Data Mesh governance examples, and AWS Data Mesh guidance).

datadatadata-image-blog

Great Expectations vs Deequ vs Soda: Data Quality Testing Tools Compared

Data quality is the unsung hero of reliable analytics, AI models, and production reporting — and when it fails, no one forgets. This article walks through three popular open-source tools for data quality testing — Great Expectations, Deequ, and Soda — so you can make a practical choice for your pipelines. You’ll get a comparison of capabilities, real-world trade-offs, deployment tips, and guidance on when to pick each tool depending on scale, team skills, and use cases.

Why data quality testing matters (and why you should care)

Bad data sneaks into systems every day: schema drift after a vendor changes a feed, null-filled records from a flaky ingest job, or subtle distribution shifts that silently poison a model. Data quality testing helps you detect and remediate these problems before they become business incidents. ThoughtWorks calls data quality “the Achilles heel of data products,” arguing that constraint-based testing and monitoring are essential parts of modern data delivery workflows (ThoughtWorks article).

At a high level, data quality testing does two things:

  • Verify incoming and transformed data meet expectations (validation in development and CI/CD).
  • Continuously monitor production data for regressions or anomalies (observability and alerting).
💡 Tip: Combine validation-as-code (tests that live with your pipelines) with monitoring (checks that run continuously in production). That two-pronged approach catches both bugs and regressions.

Quick introductions: Great Expectations, Deequ, and Soda

Before we dig into comparisons, here’s a brief primer on each tool so we’re all speaking the same language.

  • Great Expectations (GE) — Validation-as-code focused on expressive expectations, rich documentation, and data profiling. GE emphasizes human-readable expectations and stores “data docs” that explain what checks run and why. It’s especially popular for teams that want clear assertions and documentation as part of their pipelines.
  • Deequ — A library from Amazon for Spark-native data quality checks. Deequ is implemented in Scala and provides constraint- and metric-based validation that runs well on large distributed datasets. If your pipelines are Spark-heavy and you prioritize performance at scale, Deequ is worth a look.
  • Soda (Soda Core / Soda Cloud) — A lightweight scanner and observability tool that can run checks defined in YAML (SodaCL) and offers templated checks, monitoring, and alerting. Soda’s strength is a pragmatic approach to scanning and time-series monitoring of metrics with easy alert integrations.
Read more: Data Engineering Insights – how data quality fits into the larger data engineering lifecycle and AI applications.

Head-to-head comparison: what matters to engineering teams

Picking a tool is about matching features to constraints: pipeline technologies, team experience, scale, governance needs, and whether you want a heavy UI or prefer code-first checks. Below are the most important comparison dimensions.

1. Validation model and expressiveness

Great Expectations shines at expressive, human-readable expectations: completeness, uniqueness, value ranges, custom checks, and complex expectations composed from simpler ones. Telm.ai summarizes common GE metrics like completeness, uniqueness, timeliness, validity, and consistency (Telm.ai overview).

Deequ focuses on declarative constraints and statistical metrics (e.g., approximate quantiles, distribution comparisons) that are efficient in Spark. Soda provides a templated, YAML-driven approach that covers common checks quickly but can be less flexible for very bespoke validations.

2. Scalability and runtime

If your workloads run on Spark and you need checks to scale with big tables, Deequ’s Spark-native implementation gives it an edge. Great Expectations has Spark integration too, but Deequ is engineered specifically for distributed computation.

Soda is lightweight and can scan tables efficiently, but for very large datasets you’ll want to plan where scans run (e.g., within your cluster) and how frequently you scan to control costs.

💡 Tip: For petabyte-scale checks, lean on tools with native distributed compute. For smaller datasets, lightweight scanners can be faster and more cost-effective.

3. Observability, alerting, and documentation

Soda and Soda Cloud emphasize observability and alerting with templated monitors, time-series metric storage, and integrations for alerting. Great Expectations excels at documentation — auto-generated “data docs” explain expectations and test results in rich detail. ThoughtWorks highlights the value of integrating monitoring and alerting to ensure continuous data product health (ThoughtWorks article).

4. Configuration and developer experience

Great Expectations encourages validation-as-code: write expectations in Python (or YAML for some workflows), store them in version control, and run them in CI. Soda uses SodaCL (YAML) for quick, consistent configuration across teams. Deequ is code-first (Scala/Python), which is ideal for Spark engineers but can be less approachable for smaller teams without Scala skills. A Medium comparative analysis highlights these distinctions and suggests choosing tools based on pipeline complexity and team expertise (Medium comparison).

Read more: Data Engineering Services – if you need help integrating data quality tools into your pipelines, our services can help build governance and testing strategies.

5. Community, maturity, and integrations

Great Expectations has a strong open-source community and many integrations with data platforms. Deequ benefits from Amazon’s backing and a focused niche in Spark. Soda has gained traction for observability-first use cases and offers both open-source and commercial components for easier monitoring setup. Reviews and blog posts across the ecosystem point to complementary strengths and common practice of combining tools — for example, using Great Expectations for complex expectations and Soda for continuous monitoring (ThoughtWorks article).

When to choose which tool

  • Great Expectations — Choose GE when you want readable, version-controlled expectations, strong documentation, and a flexible Python-first developer experience. Great for teams focused on validation-as-code and governance.
  • Deequ — Choose Deequ when your processing is Spark-based and you need scalable, statistically robust checks on very large datasets.
  • Soda — Choose Soda when you want quick scanning, templated checks, and an observability-focused workflow with built-in alerting. Soda is often chosen for monitoring production data and lightweight scanning.
💡 Tip: You don’t always need to pick just one. Many teams mix tools — GE for validation, Deequ for Spark workloads, and Soda for production monitoring.
Read more: Cloud & Infrastructure – planning where checks run (cloud vs cluster) affects cost and latency; our cloud services can help architect the right solution.

Practical strategy to implement data quality testing

  1. Inventory critical datasets and identify business rules (start with the KPIs that matter most).
  2. Define a minimal set of checks: completeness, uniqueness, range/value validity, and schema checks.
  3. Add distribution and anomaly checks for model inputs or key metrics.
  4. Implement validation-as-code for development and CI (Great Expectations is a natural fit here).
  5. Set up continuous monitoring with templated scans and alerting (Soda or Soda Cloud works well).
  6. For big data or Spark-first pipelines, implement heavy-data checks with Deequ and export metrics to your observability layer.
  7. Automate incident playbooks that link alerts to remediation steps and owners.

Common pitfalls to avoid

  • Running expensive full-table scans too often — use sampling, incremental checks, or metric-level monitoring.
  • Writing brittle expectations that fail on normal, benign drift — favor tolerances and statistical checks where appropriate.
  • Not storing test history — historical metrics help detect gradual drift versus one-off spikes.
Read more: AI Development Services – if your models depend on data quality, our AI services include pipelines and monitoring that reduce data-related model risk.

Trends and what’s next in data quality tooling

The ecosystem continues to evolve toward observability and integration. Expect more hybrid approaches — validation-as-code combined with lightweight observability platforms, richer anomaly detection powered by time-series analytics, and better integrations into orchestration and alerting systems. Atlan and other observability-focused resources note growing support for templated checks and extensible test types as a major trend (Atlan overview).

There’s also a move to make checks more accessible to non-engineering stakeholders: simpler YAML configurations, auto-generated expectations from profiling, and clearer documentation so data consumers can understand what’s being validated.

FAQ

What is a data quality test?

A data quality test is an assertion that checks expected properties in data — for example, ensuring critical columns are not null, values fall into valid ranges, or distributions remain stable over time.

How do you test for data quality?

Define rules (expectations) for your data, implement them in pipelines or observability tools, and automate execution. Use validation-as-code in CI and monitoring tools for continuous checks in production.

What are common data quality checks?

Typical checks include completeness (no unexpected nulls), uniqueness (no duplicates), schema conformity (expected fields and types), validity (allowed values), timeliness, and distribution drift detection.

What are the 7 aspects of data quality?

The seven key aspects are accuracy, completeness, consistency, timeliness, validity, uniqueness, and integrity. Together, they form the foundation of reliable data quality programs.

What are the six data quality metrics?

Commonly tracked metrics include completeness, uniqueness, validity, timeliness, consistency, and accuracy. These dimensions help teams monitor and improve data reliability.

💡 Tip: Start with a small set of meaningful checks tied to business outcomes. Early wins build credibility for broader data quality programs.

Choosing between Great Expectations, Deequ, and Soda isn’t about finding the “perfect” tool — it’s about matching tool strengths to your stack, scale, and team. Many teams find success combining tools: expressive, version-controlled expectations for development and CI, paired with lightweight, metric-driven monitoring in production. If you’d like help designing a strategy or integrating these tools into your data platform, we’re always happy to chat and nerd out about pipelines.

clouddata-image-blog

Snowflake vs Databricks vs BigQuery: The Ultimate Cloud Data Platform Comparison

Choosing a cloud data platform can feel a bit like picking a favorite ice cream flavor while standing in a blizzard: there are lots of options, each promising to be the best for different cravings. Snowflake, Databricks, and Google BigQuery dominate the conversation, and each brings distinct strengths in performance, pricing, and developer experience. In this guide you’ll get a clear, practical comparison of their architectures, cost models, best-fit use cases, and migration considerations so you can decide which platform will actually help your team move faster (and sleep better).

Why this comparison matters

Data powers modern products and decisions. The platform you choose affects query speed, analytics agility, machine learning pipelines, and your cloud bill — sometimes dramatically. Picking the wrong option can mean slower time-to-insight, ballooning costs, or an overcomplicated architecture that only your most patient engineer understands.

We’ll walk through how Snowflake, Databricks, and BigQuery differ technically and operationally, and give practical guidance for selecting the right tool based on workload, team skills, and cost sensitivity. Along the way, we’ll reference recent analyses and comparisons so you can validate trade-offs with up-to-date info.

Quick platform overviews

Snowflake

Snowflake is a cloud-native, data warehouse-focused platform known for its separation of storage and compute, multi-cluster warehouses, and an SQL-first user experience. It’s engineered for rapid analytics, concurrency, and scale without much infrastructure tinkering. Snowflake’s credit-based pricing and capacity discounts reward predictable usage or pre-purchased capacity, and features like Snowpipe and Materialized Views help with near-real-time ingestion and faster query response.

For a recent cost and performance look at Snowflake relative to alternatives, check this concise comparison.

keebo.ai breakdown — a recent practical analysis of cost and performance trade-offs.

Databricks

Databricks started in the world of big data and ML with Apache Spark at its core. Today it’s a unified analytics platform that blends data engineering, machine learning, and analytics. Databricks shines when you need robust data pipelines, Delta Lake for ACID transactions on data lakes, and integrated ML lifecycle tools (like Delta Live Tables and Model Serving). If you want tight control over cluster behavior, autoscaling clusters and governance policies offer that flexibility.

BigQuery

Google BigQuery is a fully managed serverless data warehouse with a “just run your SQL” vibe. It excels at rapid ad-hoc queries on huge datasets, and its on-demand pricing and flat-rate options simplify cost models for different teams. BigQuery’s serverless nature reduces operations overhead, and it integrates tightly with Google Cloud’s ecosystem for analytics and ML.

For a direct comparison between BigQuery and Snowflake, this explainer is clear and practical.

DataCamp comparison — useful context on performance and pricing differences.

Performance and cost: trade-offs you need to know

Performance and cost are the twin lenses through which many decisions are made. The right choice depends on query patterns, concurrency needs, data freshness, and whether you run heavy ML workloads or mostly BI queries.

  • Snowflake: Predictable scaling and concurrency with multi-cluster warehouses. Good for mixed analytic workloads where many users run SQL queries concurrently. You pay for compute credits and storage separately.
  • Databricks: Excellent for ETL, streaming, and ML workloads thanks to Delta Lake and Spark optimizations. You manage clusters (though autoscaling helps) and can tune them for cost vs performance. Databricks often shines when you care about unified pipelines rather than pure query latency.
  • BigQuery: Serverless with strong query throughput and instant scaling. On-demand pricing is great for sporadic queries; flat-rate slots can reduce costs for high-volume, predictable workloads. Serverless means less infrastructure management, which is a cost savings in engineering time.
💡 Tip: Run a representative set of queries and pipelines on each platform before committing — real-world usage reveals true costs.
Read more: Cloud cost strategies – guidance on keeping cloud spend predictable and aligned with business goals.

Best-fit use cases

Here’s a practical way to think about which platform to pick depending on the job at hand:

  • BI and analytics at scale (many concurrent users, SQL-heavy): Snowflake or BigQuery. Snowflake’s concurrency features and BigQuery’s serverless scaling both work well; pick based on ecosystem and pricing preference.
  • Data engineering, ELT/ETL, streaming, and ML model production: Databricks. Delta Lake + integrated ML capabilities reduce friction across the pipeline.
  • Ad-hoc analytics with minimal ops overhead: BigQuery. If you don’t want to manage clusters or compute pools, serverless is attractive.
  • Hybrid/multi-cloud flexibility: Snowflake, since it’s cloud-agnostic across AWS, Azure, and GCP.
Read more: Data engineering services – when you need a partner to build reliable pipelines and governance across platforms.

Integration, migration, and architecture considerations

Moving to a new data platform is rarely a lift-and-shift — it’s typically an evolution: rethinking ETL patterns, governance, security, and orchestration.

  • Data locality and cloud provider lock-in: BigQuery is GCP-native; Snowflake and Databricks run on multiple clouds (Databricks is strong on AWS and Azure as well), but integrations and managed features vary by cloud. Consider where your other systems live.
  • Existing skills: If your team is SQL-first, Snowflake or BigQuery may have shorter ramp-up. For Spark-savvy teams focused on ML and complex transformations, Databricks will feel more natural.
  • Operational model: Serverless (BigQuery) reduces ops work. Snowflake reduces operational complexity with managed warehouses. Databricks provides deep control for ML pipelines but requires cluster management (mitigated by autoscaling).
  • Data governance: All three support encryption and role-based access, but details around fine-grained access and cataloging can differ. Plan for a metadata layer and consistent governance approach regardless of platform.
Read more: Azure cloud solutions – helpful if you’re mapping Databricks or Snowflake adoption into a broader Azure migration.

Common challenges and how to avoid them

Every platform has its pitfalls. Here’s practical advice to dodge the common ones:

  • Uncontrolled costs: Watch interactive queries, frequent small jobs, and forgotten compute clusters. Implement usage guardrails, alerts, and FinOps practices early.
  • Poor data quality: Garbage in, garbage out still applies. Invest in data validation, observability, and ownership models so bad data doesn’t become a recurring incident.
  • Fragmented metadata: Without a central catalog, teams duplicate efforts. Adopt a shared data catalog and documentation practices.
  • Underestimating egress and cross-region costs: Cloud provider pricing details matter — especially if you move data across clouds or regions frequently.
💡 Tip: Automate lifecycle policies (retention, cold storage tiering) and idle cluster shutdowns to cut down wasted spend on cloud credits.
Read more: Cloud infrastructure services – for designing secure, cost-effective cloud architectures that support your chosen data platform.

Trends and the near-term future

Over the next few years you should expect:

  • More convergence: Platforms will continue adding features that blur lines — Snowflake adding table formats that resemble lakehouse ideas, Databricks improving SQL and warehousing features, and BigQuery extending ML-first workflows.
  • Focus on open formats: Delta Lake, Apache Iceberg, and open table formats will reduce lock-in and encourage portable data lakes/lakehouses.
  • Cost management tooling: Better native FinOps features and third-party tools will become standard as teams demand predictable cloud spend.
  • Tighter ML integration: Expect deeper first-class ML support (model registries, feature stores, model serving) embedded in data platforms.
💡 Tip: Favor open formats like Delta Lake or Apache Iceberg for raw data storage so future platform shifts are less painful.

How to pick: a short decision checklist

  1. What’s the primary workload? (BI queries, ETL, streaming, ML)
  2. Where do your other systems live? (GCP, Azure, AWS, multi-cloud)
  3. How predictable is your query load? (predictable → reserved capacity; spiky → serverless/autoscale)
  4. What skills does your team already have? (SQL, Spark, data engineering)
  5. How important is operational simplicity vs. control?
  6. Can you run a short proof-of-concept on a subset of real workloads?

Run that PoC. It will reveal hidden costs, performance quirks, and predictable pitfalls faster than any sales deck.

FAQ

What is a data cloud platform?

A data cloud platform is a managed environment that stores, processes, and serves data at scale in the cloud. It combines storage, compute, security, and analytics or ML services so teams can run queries, pipelines, and models without managing physical infrastructure.

Which cloud platform is best for data analysts?

For SQL-first analytics with minimal operations, BigQuery and Snowflake are typically the best fits. BigQuery is strong for serverless, ad-hoc queries and GCP-native workloads; Snowflake provides multi-cloud support, strong concurrency, and a robust SQL experience.

Is Snowflake a cloud platform?

Yes. Snowflake is a cloud-native data platform (often described as a cloud data warehouse) running on AWS, Azure, and Google Cloud. It provides managed storage, compute, and analytics features designed for scalability and data sharing.

Is Databricks a cloud platform?

Yes. Databricks is a unified analytics platform built around Apache Spark. It’s available as a managed service across major cloud providers and is focused on scalable data engineering, machine learning, and advanced analytics workloads.

What is the most used cloud data platform?

Usage depends on region, industry, and workload. BigQuery is common in Google Cloud environments, Snowflake is widely adopted across multi-cloud enterprise analytics, and Databricks is strong in data engineering and ML. The “best” choice depends on workloads and team skills.

Read more: AI backbone – why robust data engineering is critical to realizing the value of any platform for analytics and AI.

Choosing between Snowflake, Databricks, and BigQuery is less about declaring a winner and more about matching platform strengths to your workloads, skills, and cost profile. Run tests, agree on governance, and remember: a great data strategy and solid pipelines will make any platform sing.

datateam-image-blog

What a Data Catalog Is (and Why Every Data Team Needs One)

Data is the engine behind modern business decisions, but like any engine, it needs an owner’s manual. A data catalog is that manual — a searchable, organized inventory of a company’s data assets that helps teams find, trust, and reuse data faster. In this article you’ll learn what a data catalog actually does, why it matters for analytics and AI, practical strategies for rolling one out, and common pitfalls to avoid. By the end you’ll be ready to argue (politely) that your team should have one.

Why a data catalog matters

Think of a data catalog as a well-labeled library for everything your organization produces: tables, files, ML features, dashboards, and snippets of truth that people keep discovering independently. Without a catalog, people spend hours guessing whether a dataset is trustworthy, what a field means, or who to ask for access. That costs time, creates risk, and slows innovation.

Good data catalogs improve discoverability, accelerate self-service analytics, support governance and compliance, and create transparency for AI models. Leading technology vendors describe catalogs as central metadata repositories that power discovery, automated metadata capture, and business context for data assets — core features if you want predictable outcomes from your data efforts (IBM on data catalogs, AWS on data catalogs).

💡 Tip: Treat a data catalog as a product for your internal users. Build for the people who search and make decisions, not just the engineers who manage storage.
Read more: Data Engineering Overview – Understanding data infrastructure helps explain why a catalog becomes indispensable.

What is a data catalog?

At its core, a data catalog is a metadata-driven inventory that documents what data exists, where it lives, what it means, how it’s used, and who’s responsible for it. Vendors and open-source projects implement this idea with automated harvesting, search indexation, lineage tracking, and collaboration features. For example, some platforms emphasize operational metadata capture and automated population so the catalog stays current as pipelines run (AWS), while others highlight governance, sensitivity tagging, and collaboration across stakeholders (Informatica).

Core components of a healthy data catalog

  • Metadata store: Technical and business metadata about datasets, tables, files, dashboards, and features.
  • Search and discovery: A fast search layer so users find data by name, tag, owner, or business term.
  • Data lineage: End-to-end tracing of where data came from, how it was transformed, and where it’s used.
  • Business glossary: Standardized definitions (revenue, active user, churn) to avoid semantic arguments.
  • Access controls and sensitivity tags: Who can see what, and which datasets contain sensitive PII or regulated information.
  • Usage analytics: Metrics that show which datasets are used most and by whom, helping prioritize maintenance.

In short, a catalog turns scattered metadata into an organized system that supports both governance and agility. Rather than poking around in direct SQL queries or guessing column meanings, users can find a dataset, read its description, check its lineage, and request access — all in one place.

How teams actually use data catalogs

Practical uses vary by team, but common patterns include:

  • Self-service analytics: Business analysts search for a trustworthy sales dataset and build a dashboard without nagging engineering for access.
  • Data governance: Compliance and privacy teams discover where PII lives and ensure policies are applied consistently.
  • Machine learning: Data scientists find feature tables, understand their provenance, and tag features for model explainability.
  • Data quality and ownership: Data stewards see usage patterns, triage issues faster, and identify stale assets for cleanup.

When a catalog is well-adopted, it reduces duplicated work (no more “golden table” copy created by a desperate analyst), improves reproducibility, and increases trust in analytics outputs.

💡 Tip: Encourage teams to add at least a one-line business description for every dataset. That small habit saves hours of detective work later.
Read more: Data Engineering Services – Practical engineering practices that keep data discoverable and reliable.

Implementation strategies and common challenges

Rolling out a data catalog is part technology project, part change management. Here are practical strategies and the bumps you’re likely to hit.

Start small and prioritize

Don’t attempt a full-company metadata sweep on day one. Pick a high-value domain (e.g., sales and finance) and onboard critical datasets first. Win a few quick user feedback cycles, then expand.

Automate metadata capture

Manual documentation doesn’t scale. Use tools or pipelines that automatically harvest technical metadata (schema, table stats, last updated), and combine that with hooks to capture business metadata from users. Vendors like AWS highlight automated metadata population as a key capability to keep catalogs accurate as systems change (AWS).

Define clear roles

Assign data stewards and owners who can approve descriptions, tags, and access requests. Without accountable roles, catalogs become dusty museums of ignored entries.

Balance governance with speed

Governance is essential, but heavyweight approvals will kill adoption. Use policy-as-code where possible to enforce simple guardrails (e.g., block public access to sensitive tags) while keeping day-to-day discovery fast.

Expect cultural work

Success depends as much on people as on tech. Promote the catalog as a tool that saves time and reduces risk, not a policing instrument. Celebrate contributions like helpful dataset descriptions and lineage diagrams.

💡 Tip: Launch a “data champions” program with 5–10 power users who get early access, provide feedback, and evangelize the catalog internally.
Read more: Tailored AI Solutions – How the right data practices support practical AI projects and reduce surprises.

Trends and the role of catalogs in AI

As AI becomes central to product experiences, data catalogs play a bigger role in ensuring models are trained on traceable, compliant data. Modern catalogs are evolving to support:

  • Feature registries: Catalogs are extending to manage ML features, their definitions, and lineage.
  • Data labeling and model transparency: Tags that document labeling processes and dataset biases help with audits and model interpretability.
  • Sensitivity and privacy tagging: Automated detection and labeling of PII assists in compliance and secure model training.

Vendors and practitioners emphasize metadata-driven approaches and collaboration to make AI outcomes repeatable and explainable. When your catalog includes model inputs and lineage, you reduce the “black box” feeling and make it easier to defend model decisions to stakeholders (Informatica, IBM).

Read more: AI Development Services – Practical AI implementations that benefit from disciplined data catalogs and governance.

Measuring success — what good looks like

Define metrics that demonstrate value: time-to-discovery, number of datasets with business descriptions, number of data stewards active, failed or blocked access requests, and reduction in duplicate datasets. Pair these quantitative metrics with user satisfaction surveys: if analysts are finding what they need faster and data owners are seeing fewer surprise access requests, you’re winning.

💡 Tip: Track “time-to-first-query” for new analysts. A drop in that number is a clear sign the catalog is paying for itself.

FAQ

What does data catalog mean?

A data catalog is a structured inventory of data assets and their metadata, including technical details, business context, and governance labels. It helps make data discoverable, understandable, and usable across the organization.

Why use a data catalog?

A data catalog reduces time spent searching for data, builds trust through lineage and ownership visibility, enforces governance, and accelerates analytics and AI initiatives by providing context around data assets.

What is data catalog in simple words?

It’s like a library catalog for your company’s data. It tells you what data exists, where it’s stored, what it means, and who to ask about it.

What is the difference between metadata and data catalog?

Metadata is information about data (like a column name, datatype, or last-modified timestamp). A data catalog is the system that organizes, indexes, and presents that metadata along with business context, lineage, and governance features.

What is the purpose of the data catalog?

The purpose is to make data discoverable, trustworthy, and governed. It helps teams quickly find the right data, understand its meaning and provenance, and use it safely while meeting compliance and policy requirements.

realtime-image-blog

Apache Spark vs Apache Flink vs Apache Storm for Real-Time Processing

Choosing the right engine for real-time data processing is like picking the right tool from a crowded toolbox — the wrong one makes the job slower, messier, or flat-out impossible. In this comparison we’ll look at Apache Spark, Apache Flink, and Apache Storm: how they process streams, where they shine, and what trade-offs you’ll make if you pick one over the others. You’ll learn about latency, state management, semantics (hello, exactly-once), operations, and real-world scenarios to help you decide which engine to use for your next streaming project.

Why real-time processing matters

Real-time processing turns a static, delayed view of events into an always-on, actionable stream of truth. From fraud detection and checkout personalization to telemetry monitoring and live dashboards, low-latency processing changes how businesses react to customers and systems. The right streaming platform enables teams to run analytics, update models, and trigger actions within milliseconds to seconds — which is a big competitive advantage when every millisecond counts.

Read more: Data Engineering Services – Learn how solid data pipelines and infrastructure make streaming systems reliable and scalable.

Quick overview of the contenders

Apache Spark (Structured Streaming)

Spark started as a batch engine with powerful abstractions for distributed data processing. Structured Streaming brought streaming into Spark with a micro-batch model: the engine runs continuous micro-batches that approximate streaming while reusing Spark’s batch APIs. That design makes Spark a great choice when you want a unified batch-and-stream architecture and tight integration with Spark’s broad ecosystem (MLlib, GraphX, and Spark SQL). For a deeper breakdown of structured streaming and micro-batch behavior, see the concise redpanda guide.

Apache Flink

Flink was built from the ground up for streaming and offers a native stream processing engine. That gives it low-latency event processing, strong support for event-time semantics, and sophisticated state management with exactly-once guarantees. Flink also targets a unified batch/stream approach but treats streaming as the primary mode. If you need fine-grained event-time windows, watermarks, or long-lived keyed state, Flink tends to be the go-to option. AWS’s side-by-side comparison highlights how Flink’s asynchronous I/O and native streaming are used in production scenarios like Kinesis Data Analytics.

AWS comparison – A practical look at when Flink’s streaming-first model matters for throughput and latency.

Apache Storm

Storm is one of the earliest open-source stream processors focused on tuple-by-tuple processing. It’s a pure streaming engine with a lightweight model and historically has been used for low-latency real-time processing. While newer frameworks have absorbed much of its use cases, Storm still represents the archetype of pure streaming systems and can be a solid choice for simple, high-throughput topologies or teams with existing Storm expertise. For an architectural comparison between Storm and Flink, see the Storm vs Flink showdown.

Latency, throughput, and processing semantics

When evaluating streaming engines you’ll hear three terms a lot: latency (how long an event takes to be processed), throughput (how many events per second), and processing semantics (at-most-once, at-least-once, exactly-once). The choices you make depend on your constraints:

  • Micro-batch (Spark Structured Streaming): predictable resource usage and easier integration with batch-oriented code, but higher minimum latency because events wait for the next micro-batch.
  • Native streaming (Flink, Storm): lower per-event latency because events are processed as they arrive, often preferred for sub-second response requirements.
  • Semantics: Flink offers strong exactly-once guarantees for stateful operations; Spark’s structured streaming supports end-to-end exactly-once semantics in many scenarios; Storm historically focused on at-least-once unless combined with Trident or external idempotent sinks.

For use cases where external systems are involved (databases, APIs), Flink’s support for asynchronous I/O and non-blocking external calls can yield higher end-to-end throughput, as discussed in the AWS comparison.

💡 Tip: If you need sub-second reaction times and complex event-time handling (like late arrivals or out-of-order events), benchmark Flink first.

State management and fault tolerance

State is where streaming gets interesting — and challenging. Maintaining large, keyed state across many operators requires efficient storage, checkpointing, and recovery strategies.

  • Flink: provides managed keyed state and asynchronous checkpointing to durable storage. Checkpoints and savepoints let you recover stateful jobs reliably and perform rolling upgrades or redeployments with minimal downtime.
  • Spark: implements stateful streaming via state stores and checkpoints integrated with the Spark driver and executors; Structured Streaming is designed so you can resume from safe points using checkpoint directories and commonly accepted sinks that support idempotency.
  • Storm: uses external storage or Trident semantics for strong state guarantees; however, operators tend to be more application-managed compared to Flink’s built-in state backends.

Operationally, checkpoint frequency, retention, and the choice of durable storage (S3, HDFS, cloud object stores) affect recovery time and cost. For production systems, automated testing of failure scenarios and restoring from checkpoints/savepoints should be part of your deployment checklist.

Read more: Cloud Infrastructure – Cloud storage and resilient infrastructure are key for reliable checkpointing and cost-effective recovery.

Integrations and ecosystem

Streaming rarely runs alone. You’ll almost always integrate with Kafka, Kinesis, databases, object stores, and orchestration systems. Consider how each engine plays with the ecosystem:

  • Spark: excellent integration with the wider Spark ecosystem — streaming queries can leverage MLlib models, GraphX, and Spark SQL transforms with relative ease.
  • Flink: tight connectors for Kafka, Kinesis (including Flink on Kinesis Data Analytics), and other sources; the runtime expects streaming-first thinking and provides robust connectors for stateful sinks.
  • Storm: integrates well with messaging systems and can be embedded into lightweight topologies, but often requires more glue code for complex modern integrations.

When evaluating these platforms for a live system, consider managed offerings (cloud providers’ streaming services, Flink or Spark managed clusters) that reduce operational overhead. For practical examples of how Flink and Spark are used with cloud streaming services, review the AWS comparison linked earlier.

When to choose each engine — practical guidance

Your choice should be guided by requirements, team skills, and long-term maintenance cost. Here’s a short decision guide:

  • Pick Flink when you need native streaming, event-time semantics, and advanced stateful processing (CEP, complex windows, long state retention).
  • Pick Spark when you want one engine for both batch and streaming, need easy access to Spark’s ML and SQL ecosystem, and can tolerate micro-batch latencies (tens to hundreds of milliseconds or more).
  • Pick Storm for lightweight, low-latency workloads or when you have existing Storm topologies and want minimal per-event overhead. Note that newer alternatives often meet Storm’s original use cases with richer features.

Real-world production choices often come down to operational familiarity: a team that already runs Spark at scale can often implement Structured Streaming more quickly than onboarding Flink — and vice versa. Benchmarks matter: run representative workloads to measure latency, throughput, and resource costs.

Read more: Data Engineering AI – Streaming feeds are often the lifeblood of real-time AI and personalization systems; see how strong data engineering supports those pipelines.

Challenges, trade-offs, and emerging trends

No engine is perfect. Common challenges include:

  • Operational complexity: managing state, checkpoint storage, and versioned deployments.
  • Cost vs. latency trade-offs: achieving lower latency usually means more compute and tighter resource management.
  • Consistency across systems: integrating stateful stream processing with transactional sinks and databases remains a tough coordination problem.

Emerging trends are making streaming easier and more powerful. Unified stream-and-batch architectures, more managed cloud offerings, serverless or autoscaling streaming runtimes, and better developer ergonomics (stream SQL, improved SDKs) are moving the needle. The community comparisons and guides (including the redpanda guide and AWS side-by-side article) show the landscape evolving toward higher-level abstractions and operational simplicity.

Read more: AI Development Services – Streaming data is often the real-time input for AI models; see how AI projects consume streaming pipelines in production.
💡 Tip: Start with a small, representative pipeline and measure. Don’t choose a platform on features alone — test real-world latency, recovery time, and cost.

FAQ

What is real-time data processing?

Real-time data processing ingests, processes, and acts on data almost immediately after it’s produced. “Real-time” can mean sub-second or a few seconds depending on context, but the key is minimal lag between event and actionable output.

Which tool is used for real-time data processing?

Common open-source tools include Apache Flink, Apache Spark (Structured Streaming), and Apache Storm. Each has trade-offs: Flink excels in native streaming and state handling, Spark integrates streaming with batch workloads, and Storm provides lightweight, low-latency tuple processing.

What are the two characteristics of real-time data processing?

Two defining traits are low latency (fast event-to-result turnaround) and continuous processing (persistent pipelines that handle ongoing streams). Other important factors include fault tolerance and stateful processing.

What is the difference between online and real-time data processing?

“Online” means systems are live and serving requests, while “real-time” emphasizes minimal latency in processing. Online systems can be real-time, but not all online systems are designed for low-latency data handling.

What are some examples of real-time processing?

Examples include fraud detection during payments, updating recommendations as users click, anomaly detection in telemetry, live dashboards, and real-time personalization of user experiences.

etlbusiness-image-blog

What Reverse ETL Really Is (and Why Your Business Needs It)

Reverse ETL has quietly become one of those tech topics that sounds backwards until you realize it fixes the things you actually care about — like sales teams having up-to-date customer scores, marketers personalizing campaigns without spreadsheets, and support reps seeing the full customer context in their apps. In this article I’ll explain what reverse ETL is, how it differs from traditional ETL (and CDPs), practical use cases, and how to avoid common pitfalls when rolling it out. If you want your data to stop living in a warehouse tomb and start doing useful work, you’re in the right place.

What is reverse ETL?

Reverse ETL is the process of taking transformed, modeled data from your centralized data warehouse or lake and sending it out to operational systems — CRMs, marketing platforms, customer success tools, ad platforms, and more. Instead of extracting raw source data, transforming it, and loading it into a warehouse (traditional ETL), reverse ETL moves curated, business-ready datasets back to the frontline tools where people make daily decisions.

Think of the data warehouse as the company’s brain and the operational apps as muscles. Reverse ETL is the nervous system that delivers insights from brain to muscles so the whole body can move in sync. For a practical breakdown of how the process works and examples, see Domo’s process guide on reverse ETL.

Why it matters for your business

Organizations invest in data warehouses and analytics to answer strategic questions. But analytics becomes truly valuable when it changes behavior and actions in operational workflows. Reverse ETL operationalizes analytics by syncing the right, trusted data into the tools your teams use every day. That could mean:

  • Auto-updating lead scores in your CRM so sales prioritizes the right prospects.
  • Feeding product usage signals into support tools so reps troubleshoot faster.
  • Syncing segments and attributes to ad platforms for better-targeted campaigns.

Multiple vendors and thought leaders highlight these benefits: Matillion outlines how automated flows reduce manual reporting, while Dinmo emphasizes use cases for personalization and streamlined business processes. When analytics lives only in dashboards, its impact is limited. Reverse ETL closes that loop.

💡 Tip: Start by syncing one high-impact dataset (e.g., customer lifetime value or lead score) to a single operational tool. Prove value quickly before scaling to dozens of destinations.

How reverse ETL fits into the modern data stack

Reverse ETL sits downstream of your warehouse. The pipeline looks like: data ingestion → transformation/modeling in the warehouse → reverse ETL syncs curated datasets to operational systems. This pattern keeps trusted business logic centralized while letting frontline teams act on the same source of truth.

ETL vs. reverse ETL

Traditional ETL (extract, transform, load) pulls source data into a centralized store for analysis. Reverse ETL does the opposite: it takes curated, analytics-ready data and loads it into source-of-action systems. They’re complementary — ETL centralizes and models, reverse ETL operationalizes.

For a clear comparison and practical use-case breakdown, RudderStack provides a useful primer on customer data activation and syncing to CRMs and marketing tools.

Read more: Data Engineering for AI – Learn why well-built data pipelines are the foundation that makes reverse ETL reliable and repeatable.

Common use cases and a concrete example

Reverse ETL fits wherever operational teams need enriched data. Common use cases include:

  • CRM enrichment: Add behavioral signals, propensity scores, and churn risk to contact and account records so sales and CS act on current insights.
  • Marketing personalization: Sync segments and user attributes to marketing automation and ad platforms for tailored experiences and better ROI.
  • Support and success workflows: Provide product telemetry and SLA status directly in ticketing systems for faster, more informed service.
  • Finance and ops automation: Feed upstream billing or fulfillment systems with analytics-driven adjustments (e.g., credit limits, discount eligibility).

Example: A SaaS company uses reverse ETL to push a real-time churn-risk score from the warehouse into Salesforce. Sales reps receive alerts when a high-value account’s health drops, enabling proactive outreach and tailored retention offers. Many vendor guides show similar scenarios — see Dinmo’s use cases for operational sync patterns and Matillion’s guide to automating flows.

💡 Tip: Treat attributes you sync like an API contract — name them clearly, version them intentionally, and document expected ranges or enum values. This prevents misalignment between dashboards, models, and apps.

How to implement reverse ETL (practical steps)

Implementing reverse ETL is more of a people-and-process project than a pure technology install. Here’s a practical roadmap:

  1. Identify high-value datasets to sync: Start with metrics that will change a clear business action (e.g., lead score, churn risk, LTV).
  2. Model and validate in the warehouse: Ensure your dataset is tested, documented, and updated by a reliable process (ideally using the same transformations your analytics team trusts).
  3. Choose destinations and map fields: Match warehouse columns to destination object fields, respecting data types and rate/size limits.
  4. Decide sync cadence and conflict rules: Near real-time vs. batch depends on use case and destination API limits; define how to resolve updates from either side.
  5. Automate monitoring and observability: Track sync success rates, latency, and schema changes so incidents are caught early.
  6. Govern and secure: Apply access controls, encryption, and error-handling to protect PII and comply with regulations.

Tools and vendor features vary — Integrate.io highlights the importance of automated pipelines and governance, and Matillion discusses operational analytics to reduce manual work. Whatever tool you pick, ensure it supports the destinations and scale you need.

Read more: Data Engineering Services – If you need help building the warehouse models and pipelines that feed reverse ETL, this explains how we approach data engineering projects.

Common challenges (and how to avoid them)

Reverse ETL brings useful data to the front lines, but there are pitfalls:

  • Data freshness vs. cost: Near real-time syncs are great, but API costs and rate limits can bite. Balance cadence with business impact.
  • Schema drift and mapping errors: Changes to the warehouse model or destination schema break syncs. Version and test changes with a staging environment.
  • Duplicate or conflicting records: Ensure deduplication logic and consistent identifiers (e.g., universal customer ID) across systems.
  • Security and compliance: Pushing PII increases compliance surface area. Use encryption, scoped credentials, and strict audit logs.
  • Operational ownership: Who owns the synced data — analytics, ops, or the consuming team? Define clear responsibilities and SLAs.

Address these issues with governance, observability, and clear operational processes. Vendors like Integrate.io and Matillion emphasize governance and automated observability as key to scaling safely.

Read more: Cloud Infrastructure Services – Architecting secure, scalable infrastructure matters for real-time pipelines and availability when you push data to many endpoints.

Trends and what’s next

Reverse ETL continues to evolve as part of the larger trend to operationalize data. A few directions to watch:

  • Streaming and lower-latency syncs for operational AI and real-time personalization.
  • Stronger governance and data contracts to handle multi-team ownership and compliance.
  • AI-driven orchestration that recommends which datasets to sync and optimizes cadence based on business impact.

Vendors and guides suggest that as analytics and AI move from insight generation to action automation, reverse ETL will be central to delivering trusted signals into action systems. Domo and Matillion both highlight the role of operational analytics, and Integrate.io underscores governance as adoption scales.

Read more: AI Development Services – If you’re thinking about using synced data to power AI-driven experiences, this explains how we build tailored AI solutions safely and effectively.

FAQ

What is reverse ETL?

Reverse ETL exports curated, modeled data from your warehouse or lake into operational systems like CRMs, marketing platforms, or support tools. This enables teams to act on insights directly within their daily workflows.

How is reverse ETL different from ETL?

ETL (extract, transform, load) centralizes raw source data into a warehouse for analysis. Reverse ETL pushes analytics-ready data back out to frontline systems so it can power real-time actions and decisions.

What are common use cases for reverse ETL?

Typical use cases include CRM enrichment (adding churn risk or scores), marketing personalization (sending segments to ad platforms), support workflows (embedding product signals in tickets), and finance automation (feeding billing systems).

Can you give an example?

A SaaS company calculates a churn-risk score in its warehouse. Reverse ETL syncs that score into Salesforce so sales reps can proactively reach out to at-risk accounts with tailored offers.

How does reverse ETL compare to a CDP?

CDPs focus on collecting and unifying customer data, with some activation features. Reverse ETL instead treats the warehouse as the source of truth and distributes curated datasets into tools. Both overlap in activation, but their architectures differ.

dataarchitecture-image-blog

Medallion Architecture vs Data Vault: Which Data Modeling Approach Wins?

Choosing a data modeling approach can feel a bit like choosing between two excellent coffees: both will wake you up and get the job done, but the flavor, strength, and ritual differ. In the data world, Medallion Architecture and Data Vault are two popular patterns with different goals and trade-offs. This article explains what each one is, where they shine, how they can work together, and how to pick the right path for your organization.

By the end you’ll understand the core differences, practical use cases, implementation tips, and common pitfalls — so you can recommend a strategy with confidence (and maybe a little style).

What is Medallion Architecture?

Medallion Architecture is a layered pattern for organizing data in modern lakehouses and data platforms. The basic idea is simple and elegant: move raw data through a series of refinement stages so it becomes trustworthy, performant, and ready for analytics or operational use. The common tiers are Bronze (raw ingestion), Silver (cleaned and joined), and Gold (business-ready, aggregated, or curated models).

This approach emphasizes ELT-style incremental refinement, pipelines that transform data as it moves from layer to layer, and a clear separation of concerns between raw storage and curated output. For a concise breakdown of these layers and their goals, see Databricks’ overview of the Medallion pattern (Databricks’ Medallion explainer).

When Medallion shines

  • Speed of iteration: teams can rapidly build pipelines from Bronze to Gold.
  • Simplicity: clear stages make it easy to define responsibilities and observability.
  • Business-focused delivery: Gold tables map directly to reports, dashboards, or ML features.
💡 Tip: Start with a minimal Bronze–Silver–Gold pipeline for a single critical domain. Iterate from there — too many layers early on complicate governance more than they help.
Read more: AI solutions backbone – good background on why a solid data foundation (like Medallion) matters for AI projects.

What is Data Vault?

Data Vault is a modeling technique designed for scalable, auditable, and historically accurate data integration. Instead of designing around business-friendly tables, Data Vault breaks entities into Hubs (keys), Links (relationships), and Satellites (context and descriptive attributes). This separation makes it easier to ingest changing source systems and maintain a full-history, traceable store of what happened when.

Data Vault is intentionally schema-driven and normalization-friendly, which is useful in large organizations with many source systems or when regulatory auditability is required. For a practical perspective on how Data Vault compares to other canonical models, check Matillion’s comparison pieces that discuss Data Vault alongside star schemas and 3NF (Matillion on 3NF vs Data Vault).

When Data Vault shines

  • Complex source environments: many systems with overlapping or changing keys.
  • Regulatory and audit needs: full historical preservation and lineage are first-class features.
  • Long-term scalability: schemas evolve without rewriting historical records.
Read more: Data Engineering Services – explains how customized services can help implement techniques like Data Vault.

Direct Comparison: How They Differ

Philosophy

Medallion is a pragmatic pipeline framework: raw to refined to business-ready. Data Vault is a modeling philosophy: build a scalable, auditable foundation that captures everything and evolves safely. Medallion focuses on stages and transformation flow; Data Vault focuses on structural separation and historical fidelity.

Design & Modeling

Medallion’s Silver and Gold layers often contain denormalized or dimensional models tuned for analytics performance. Data Vault prefers normalized components (Hubs/Links/Satellites) that make integration and historical tracking straightforward. That means Data Vault tends to have more tables/objects but fewer surprises when source systems change.

Speed vs Governance

Medallion is designed for fast iteration and delivering business-ready datasets quickly. Data Vault prioritizes governance, traceability, and robustness. If your team needs fast time-to-insight, Medallion can get you there. If you need long-term mastery of lineage and history, Data Vault is appealing.

Cost and Complexity

Data Vault can increase object-count and query complexity, which raises storage/compute and modeling overhead. Medallion’s curated Gold tables can be optimized for cost and performance, but that often requires repeated engineering effort to keep them aligned with changing business needs.

💡 Tip: If you must pick one approach today, choose based on the primary constraint: need-for-speed (Medallion) or need-for-scale/traceability (Data Vault). You can always introduce complementary tactics later.
Read more: Data Engineering Services – useful if you’re considering hiring experts to design a Medallion/Data Vault implementation.

Hybrid: When Medallion and Data Vault Work Together

They don’t have to be rivals. Many modern implementations use Data Vault as the integration layer (capturing raw, historical truths) and the Medallion pattern to progressively refine that raw store into business-ready Gold outputs. In other words: Data Vault as the reliable, auditable Bronze/Silver foundation, then Medallion transforms for analytics and operational needs.

This hybrid is becoming more common in lakehouse platforms and cloud fabrics. For examples of blending the two — including the idea of a Business Vault for abstraction — see Trifork’s take on modern data warehouse patterns and an exploration of the combined approach in Microsoft Fabric (Trifork on modern data warehouses and Datavault + Medallion in Fabric).

Practical hybrid workflow

  1. Ingest source events into Bronze: raw files or change-data-capture streams.
  2. Model Hubs/Links/Satellites in a Vault-style raw layer for lineage.
  3. Build Silver curated tables that join vault components into cleaned domain models.
  4. Create Gold aggregates, dimensional models, or feature stores for consumption.
Read more: AI Development Services – hybrid architectures are particularly effective when your AI models need both historical fidelity and business-ready features.

Implementation Guidance: Practical Checklist

  • Define your goals first: speed, governance, or both? Let that guide architecture.
  • Start small: pick one domain for a pilot that exercises ingestion, lineage, and consumption.
  • Automate metadata and lineage capture: both approaches benefit from strong observability.
  • Monitor cost & performance: normalized vault layers can be query-intensive; use materializations or caching for heavy reads.
  • Plan for evolution: schema drift, key changes, and new sources are inevitable — design for them.
💡 Tip: Invest early in a small but readable data catalog and lineage dashboard. It pays off faster than optimizing a dozen Gold tables that nobody understands.

Common Challenges & How to Avoid Them

Medallion pitfalls

  • Lack of governance: Bronze can become a data swamp without metadata and retention policies.
  • Duplication: multiple Gold tables for similar needs can cause maintenance drift.
  • Hidden lineage: transformations across layers need clear provenance to be trustworthy.

Data Vault pitfalls

  • Complexity explosion: many small tables can be overwhelming without automation.
  • Performance: direct BI queries over vault structures may be slow—use downstream materializations.
  • Adoption gap: business users often prefer dimensional models, so plan for downstream translation.

Trends & The Road Ahead

Cloud-native lakehouses and managed platforms are enabling hybrid patterns to flourish — think Delta Lake, Snowflake, or Fabric-style environments where Data Vault captures raw history and Medallion pipelines produce business-facing models. Tooling for automation, metadata management, and SQL-first transformation frameworks continues to mature, lowering the operational cost of both approaches (Matillion comparison).

Expect better integrations between modeling frameworks, more robust metadata ecosystems, and stronger templates for hybrid vault-medallion patterns as best practices converge.

FAQ

What are the 4 types of data modeling?

Commonly referenced types include conceptual, logical, physical, and dimensional models. Conceptual captures high-level entities and relationships; logical defines structure without platform specifics; physical maps designs to database tables and indexes; dimensional organizes data for analytics using facts and dimensions.

What are the three levels of data modeling?

The three canonical levels are conceptual, logical, and physical. Conceptual focuses on business concepts, logical on normalized structures and relationships, and physical on storage in a database. Dimensional models are often considered a specialization tailored for analytics.

What is a data modeling tool?

A data modeling tool is software that helps design, visualize, and maintain data models, from ER diagrams to schema evolution. They often integrate with metadata catalogs and generate DDL or migration scripts to manage complexity, enforce standards, and support collaboration.

What is data modeling in SQL?

Data modeling in SQL means designing table schemas, keys, constraints, and relationships for relational databases or warehouses. It includes defining column types, indexes, and query patterns to ensure performance and correctness, often implemented via SQL-first transformation tools.

What is meant by data modeling?

Data modeling is the practice of creating abstract representations of data structures and relationships to support applications, analytics, and governance. It aligns business concepts with technical implementation to ensure performance, consistency, and adaptability.

Read more: Cloud Cost Strategies – useful if implementing either architecture affects cloud spend and you want to pair modeling decisions with cost control.

Final Thoughts

There’s no single “winner” in the Medallion vs Data Vault debate — only the right choice for your priorities. Medallion accelerates delivery and clarity for analytics; Data Vault gives you a durable, auditable foundation for complex, evolving source environments. Many teams find the sweet spot in a hybrid approach: capture everything in a Vault-style raw layer, then refine via Medallion pipelines into business-ready outputs.

Pick based on constraints, pilot wisely, automate metadata, and remember: the goal is useful, trusted data — not model purity. If you want help designing a pragmatic, production-ready approach that balances speed, governance, and cost, experts (like us) can help architect a strategy tailored to your needs.

Read more: Custom Software Solutions – if you need tailored tooling or integrations to operationalize your chosen modeling approach.
datagovernance-image-blog

Data Contracts vs Data SLAs: Ensuring Data Quality at Scale

Data teams are increasingly asked to deliver trustworthy, timely data to decision-makers, and doing that at scale feels a bit like trying to herd very opinionated cats. Two concepts that help tame chaos are data contracts and data SLAs (Service Level Agreements). They sound similar, and they overlap, but they serve different roles in a healthy data ecosystem. In this article you’ll learn what each one is, how they work together, where they differ, and practical steps to implement them so your data behaves like the reliable team player it’s supposed to be.

Why this matters

As organizations rely more on analytics, machine learning, and automated workflows, the cost of bad data goes up fast — wrong decisions, failed models, and angry stakeholders. Data contracts and data SLAs are governance tools that reduce surprises. Contracts define expectations between data producers and consumers, while SLAs quantify performance and reliability. Together, they help teams move fast without leaving quality behind.

💡 Tip: Start small — pilot data contracts on a single high-value dataset and define a couple of critical SLAs (freshness and completeness) before scaling.

What is a data contract?

At its simplest, a data contract is an agreement — often machine-readable — between the team producing a dataset and the team consuming it. It specifies expectations such as schema, semantics, ownership, and quality rules. A good contract answers the “what” and “who”: what fields are required, what each field means, what validation to run, and who owns fixes.

Data contracts can be as lightweight as a documented schema and ownership list or as systematic as code-driven, machine-enforced specifications. For a practical walkthrough and best practices, see the Monte Carlo guide and the DataCamp primer.

Core elements of a data contract

  • Schema definition (field types, nullability)
  • Semantic definitions (what a column actually means)
  • Validation rules (ranges, formats, referential integrity)
  • Ownership and contact points
  • Expectations for updates or change management
💡 Tip: Treat contracts like code — version them, review changes in PRs, and automate enforcement to prevent downstream breakages.

What is a data SLA?

Data SLAs quantify the level of service data must provide. Borrowing the language of ops, SLAs define measurable targets for things like freshness (how up-to-date data must be), availability (how often a dataset is accessible), completeness (what percentage of rows must be populated), and latency (how long consumers must wait for new data).

SLAs make expectations objective and testable. Instead of saying “data should be fresh,” an SLA says “95% of records must be updated within 30 minutes of the source event.” Integrating SLAs into contracts is a recommended approach; you can see examples of embedding freshness and latency guarantees in writing at DataCamp and in productized forms discussed by Alation.

Common SLA metrics

  • Freshness: time since last successful update
  • Availability: percent uptime or query success rate
  • Completeness: proportion of expected records present
  • Accuracy: error rates or anomaly counts
  • Latency: processing time for streaming or batch pipelines
Read more: SLA framework details – a deeper look at tailoring SLAs to risk and budget for managed services.

Data contracts vs. data SLAs — how they differ (and overlap)

People often use the terms interchangeably, but they are complementary. Think of a data contract as the playbook describing how teams should behave and an SLA as the scoreboard showing whether those behaviors meet agreed levels. Contracts set expectations (schema, ownership, validation), and SLAs put measurable thresholds on aspects like freshness and availability.

Overlap exists when contracts embed SLAs as explicit clauses. That’s a best practice: it prevents ambiguity and makes enforcement easier because the SLA lives next to the schema and validation rules.

A quick analogy

Imagine a restaurant. The data contract is the menu and kitchen rules (what ingredients, how a dish is prepared, who’s responsible). The SLA is the promise that your food will arrive within 20 minutes and be hot and complete. Both are required for a happy diner.

Read more: AI solutions backbone – useful context on why reliable data foundations power AI work and how contracts/SLA thinking fits into that pipeline.

Strategies for implementing data contracts and SLAs

Practical rollout plans prioritize incremental adoption and automation. Here’s a pragmatic roadmap that doesn’t require a team of data lawyers:

  1. Identify critical datasets: start where business impact is highest (billing tables, core user events, model features).
  2. Draft lightweight contracts: include schema, owner, acceptable nulls, and one or two key SLAs (freshness, completeness).
  3. Automate checks: implement schema validation and SLA monitoring in CI/CD or data quality pipelines. Tools like dbt freshness tests or dedicated monitoring platforms help here; see implementation notes from Monte Carlo.
  4. Set escalation paths: define what happens when an SLA is missed — alerts, mitigation steps, and root cause ownership.
  5. Iterate and expand: use metrics from monitoring to refine SLAs and broaden contract coverage.
💡 Tip: Keep consumer needs front and center. Build SLAs that reflect real priorities instead of trying to meet every possible requirement.

Common challenges and how to avoid them

Rolling out contracts and SLAs is not always smooth. Here are common pitfalls and practical fixes:

  • Too rigid or too fuzzy: Contracts that are overly strict block change; vague contracts create confusion. Balance specificity with flexibility — use versioning and change notifications.
  • No monitoring: Contracts without enforcement are aspirational. Automate tests and run SLAs against production metadata.
  • Lack of ownership: If nobody owns a dataset, nobody fixes it. Assign clear owners in the contract with backup contacts.
  • Metric overload: Tracking too many SLAs creates alert fatigue. Focus on a small set of high-impact metrics.
  • Unclear remediation: Define triage steps and SLO-based penalties or incentives to ensure action when SLAs break.
Read more: Data engineering services – how tailored engineering practices can embed contract/SLA enforcement into pipelines.

Tools and trends to watch

The tooling landscape is evolving quickly. A few notable trends:

  • Machine-readable contracts: Tools that store contracts as code (YAML/JSON) allow automated enforcement and drift detection; see the machine-readable approach discussed by Hevo Academy.
  • Embedded SLA checks: Modern pipelines include freshness and completeness checks as part of deployment; many teams leverage data warehouse metadata and timestamps to validate SLAs, as noted in Monte Carlo’s warehouse guidance.
  • Shift-left validation: Run schema and quality tests earlier in the pipeline to prevent bad data from reaching consumers.
  • Consumer-driven contracts: Driven by downstream needs, this approach centers the contract around consumer expectations rather than just producer convenience.
Read more: AI development services – shows how high-quality data is foundational to successful AI projects.

Practical checklist to get started

  • Choose 2–3 critical datasets and document owners and intents.
  • Create a simple contract: schema, semantics, and one SLA each for freshness and completeness.
  • Automate validation using your existing tools (dbt, tests, monitoring dashboards).
  • Define alerting thresholds and remediation playbooks.
  • Run a monthly review to tune SLAs and expand contract coverage.

FAQ

What does data quality mean?

Data quality measures how well data meets consumer needs. It includes accuracy, completeness, timeliness, validity, and consistency to ensure trust and reliability.

How do you measure data quality?

By using metrics such as completeness percentage, freshness latency, error rates, and accuracy checks. SLAs make these metrics measurable and enforceable.

What are the data quality objectives?

They are target levels for quality aligned to business needs — for example, “95% of events processed within 15 minutes.” Objectives should be specific and measurable.

What are the 7 dimensions of data quality?

The seven dimensions are accuracy, completeness, consistency, timeliness, validity, uniqueness, and integrity. They guide checks and highlight problem areas.

How do you ensure data quality?

Through governance, contracts, and SLAs. Automate validation and monitoring, assign ownership, and define remediation workflows with regular audits and feedback loops.

💡 Tip: Don’t view contracts and SLAs as bureaucracy — they’re communication tools that save time and reduce firefighting.

Conclusion

Data contracts and data SLAs each play a distinct role in ensuring data quality at scale: contracts set expectations and ownership, while SLAs make performance measurable. When you combine clear, machine-readable contracts with focused, automated SLAs, teams can scale confidently and spend less time firefighting and more time delivering insight. Start small, automate where possible, and iterate based on real-world feedback — your data consumers will thank you, and the chaos of opinionated data cats will subside (mostly).