dataengineering-image-blog

Kubernetes vs Docker for Data Engineering: Container Orchestration Guide

Containers have become the Swiss Army knife of modern data engineering — compact, flexible, and occasionally surprising you with a handy tool when you least expect it. But when your data pipelines need to scale, heal themselves, and play nicely across clouds, the choice between Docker and Kubernetes stops being academic and starts being strategic. In this guide you’ll learn what each tool actually does, when to use Docker alone, when to step up to Kubernetes, practical strategies for production data pipelines, and how to avoid the common potholes teams hit on the road to a resilient orchestration setup.

Why container orchestration matters in data engineering

Data engineering workloads are no longer single, monolithic jobs that run on a VM and go to sleep. Modern pipelines are composed of many small services — extractors, transformers, model-serving endpoints, and observability agents — that must run reliably, scale with demand, and recover from failure automatically. This is where container orchestration comes in: it automates deployment, scaling, networking, and lifecycle management for containerized applications so you can focus on data logic instead of babysitting infrastructure.

For a practical, hands-on look at how virtualization, Docker, and Kubernetes tie into data engineering workflows, the Coursera course on virtualization, Docker, and Kubernetes is an excellent refresher.

Read more: Data Engineering for AI – a deeper look at why robust pipelines are critical when powering AI systems and how data infrastructure supports model performance.

Docker and Kubernetes — clarifying roles (they’re not direct competitors)

First, let’s clear a common misconception: Docker and Kubernetes serve different purposes. Docker is primarily a platform for building, packaging, and running containers. Kubernetes is an orchestration system for managing containers at scale across a cluster of machines. Think of Docker as the shipping container and Kubernetes as the port authority that coordinates thousands of containers arriving, docking, moving, and leaving.

The distinction is well summarized in practical guides like the Docker blog post on how Docker and Kubernetes work together and the Datacamp comparison article that breaks down roles and advanced Kubernetes features like self-healing and load balancing in clear terms (Datacamp: Kubernetes vs Docker).

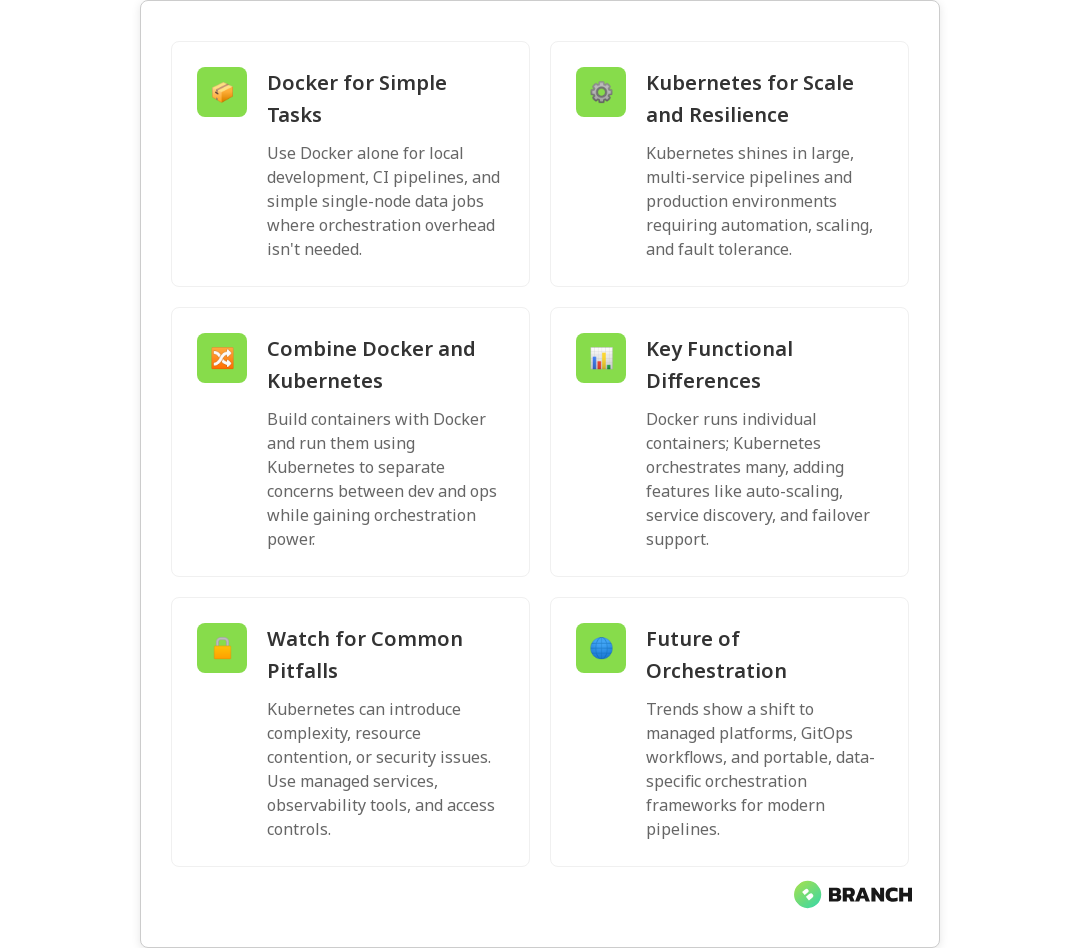
Key functional differences

  • Container creation and runtime: Docker builds images and runs single containers.
  • Orchestration and cluster management: Kubernetes manages groups of containers across many nodes, handling scheduling, scaling, and recovery.
  • Networking and service discovery: Kubernetes provides built-in load balancing and service abstractions suited to microservice and pipeline architectures.
  • Persistence and state: Kubernetes integrates concepts like PersistentVolumes, StatefulSets, and Jobs for stateful workloads and batch jobs common in data engineering.

When to use Docker alone (short pipelines, local dev, simple CI)

Docker alone is great when your needs are simple. Use Docker for:

  • Local development and testing of extract-transform-load (ETL) components.
  • CI pipelines that build and run containers for unit and integration tests.
  • Single-node processing or scheduled batch jobs where high availability and cluster-level scaling aren’t required.

If your pipeline is small, latency-insensitive, and managed through a single orchestrator (like a scheduler on a VM), Docker gives you repeatable environments with minimal operational overhead. It keeps things lightweight and fast to iterate.

Read more: Data Engineering Solutions – for how production-grade pipelines are architected beyond local containers into scalable, reliable systems.

When Kubernetes makes sense (scale, reliability, multi-service pipelines)

Choose Kubernetes when you need:

  • Elastic scaling across many services or tenants.
  • Self-healing so jobs restart automatically after node or Pod failures.
  • Advanced networking, service discovery, and observability across components.
  • Multi-cloud or hybrid deployments where portability and standardization matter.

Kubernetes shines in production environments where uptime, automation, and scale are priorities. If your data stack includes streaming systems, model-serving endpoints, and multiple microservices, Kubernetes provides the primitives to tie those pieces together reliably. For a beginner-friendly overview of orchestration options and portability, Splunk’s Container Orchestration guide is an approachable resource.

Hybrid approach: Docker + Kubernetes

In many real-world deployments you’ll use Docker to build images and Kubernetes to run them. CI/CD pipelines build Docker images, then Kubernetes handles rollout, scaling, and updates. This combo minimizes friction between development and operations while enabling production-grade orchestration.

💡 Tip: Start with Docker for local development and CI, then adopt Kubernetes incrementally. Prototype on managed offerings (EKS, AKS, GKE) or use local clusters like Kind or Minikube before migrating workloads.

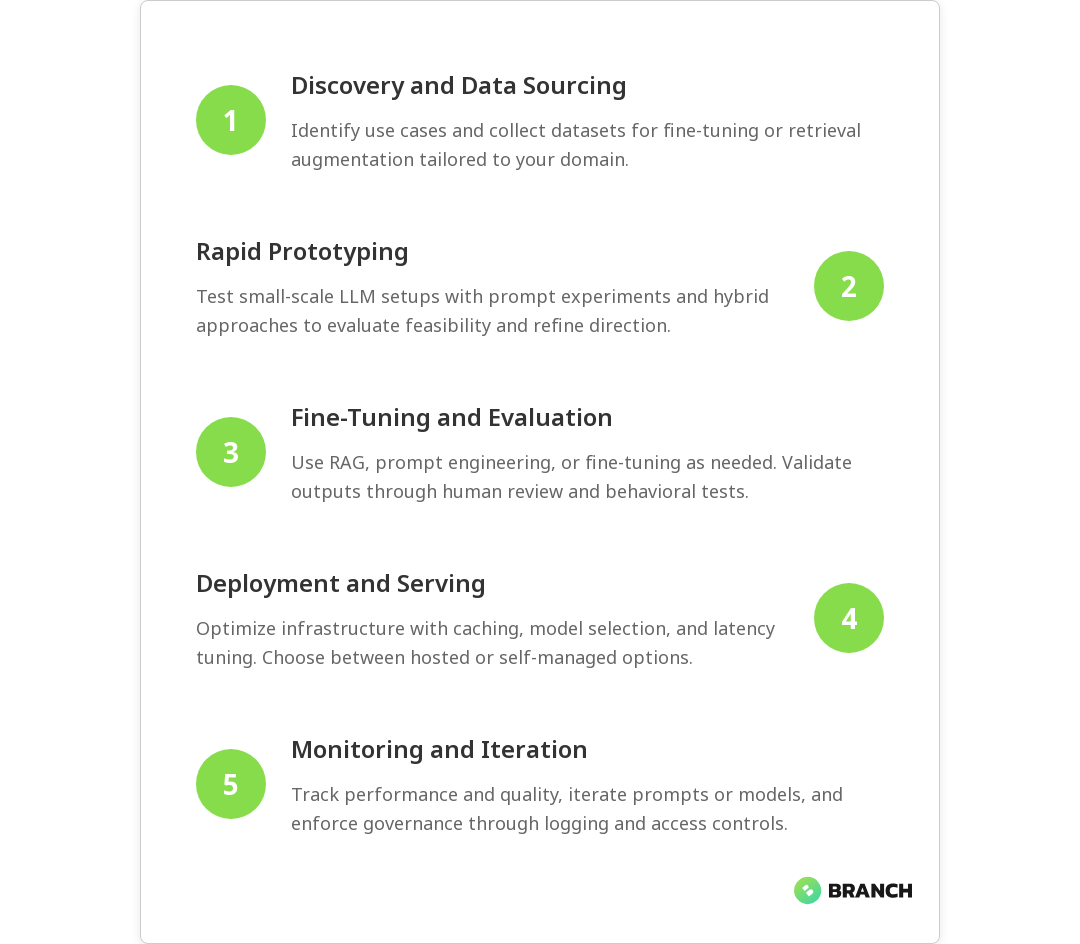
Strategies for running containerized data pipelines

Here are practical strategies to make container orchestration work for data engineering, not against it:

  1. Design for idempotency and checkpointing. Data jobs should be restartable without duplicating results. Use checkpoints or metadata stores to track processed offsets or batches.
  2. Use Kubernetes Jobs and CronJobs for batch tasks. Kubernetes provides native primitives for one-off and scheduled jobs — ideal for nightly loads and backfills.
  3. Separate compute from storage. Keep state in managed object stores or databases, not container filesystems, so compute can scale independently.
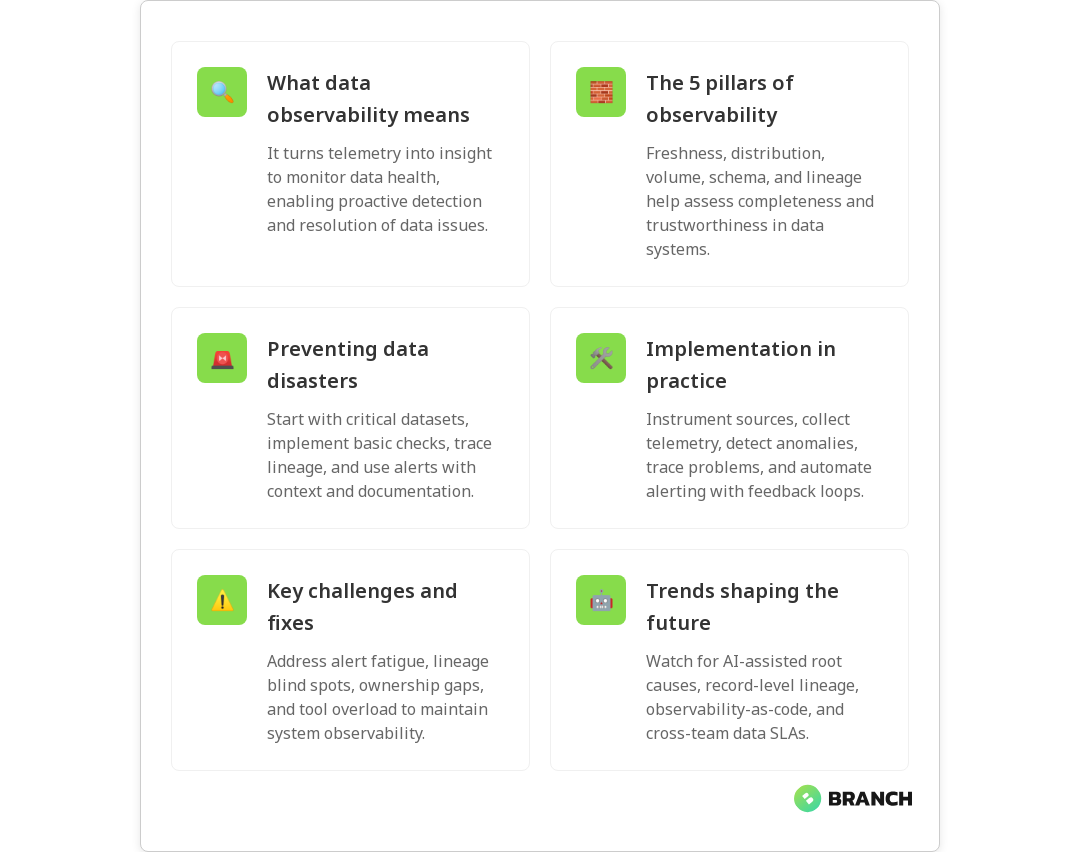
  4. Automate observability. Integrate metrics, logs, and tracing early. Kubernetes makes it easy to attach sidecar containers or agents for telemetry.
  5. Leverage managed services where appropriate. Managed Kubernetes (GKE, EKS, AKS) and cloud-native serverless containers can simplify operations while retaining portability.
Read more: Cloud Infrastructure Services – for help deciding when to use managed cloud services vs. self-managed clusters and how to design secure, scalable cloud environments.

Common challenges and how to overcome them

Adopting containers and Kubernetes adds complexity. Here are the frequent problems teams hit and practical fixes:

  • Operational complexity: Kubernetes has a learning curve. Mitigate by using managed offerings, adopting GitOps practices, and investing in observability and runbooks.
  • Resource contention: Misconfigured requests and limits can lead to noisy neighbors. Use resource quotas, vertical/horizontal autoscaling, and testing under load.
  • Security and compliance: Containers introduce a supply chain. Harden images, scan for vulnerabilities, and apply network policies and RBAC.
  • Stateful workloads: Running stateful services in Kubernetes requires PersistentVolumes and careful consideration of data locality and backups.
💡 Tip: Treat orchestration like a product: define SLAs, create runbooks, and run regular chaos or failover drills so your team can recover quickly when things break.
Read more: AI Development Services – useful when connecting data pipelines to model-serving requirements and ensuring your models receive reliable inputs in production.

Trends and the future of orchestration in data engineering

The orchestration landscape keeps evolving. Here are trends to watch:

  • More managed and opinionated services: Cloud providers continue to deliver managed orchestration and serverless containers that reduce operational burden.
  • Tighter CI/CD and GitOps integration: Deployments are increasingly automated via declarative configs and GitOps workflows.
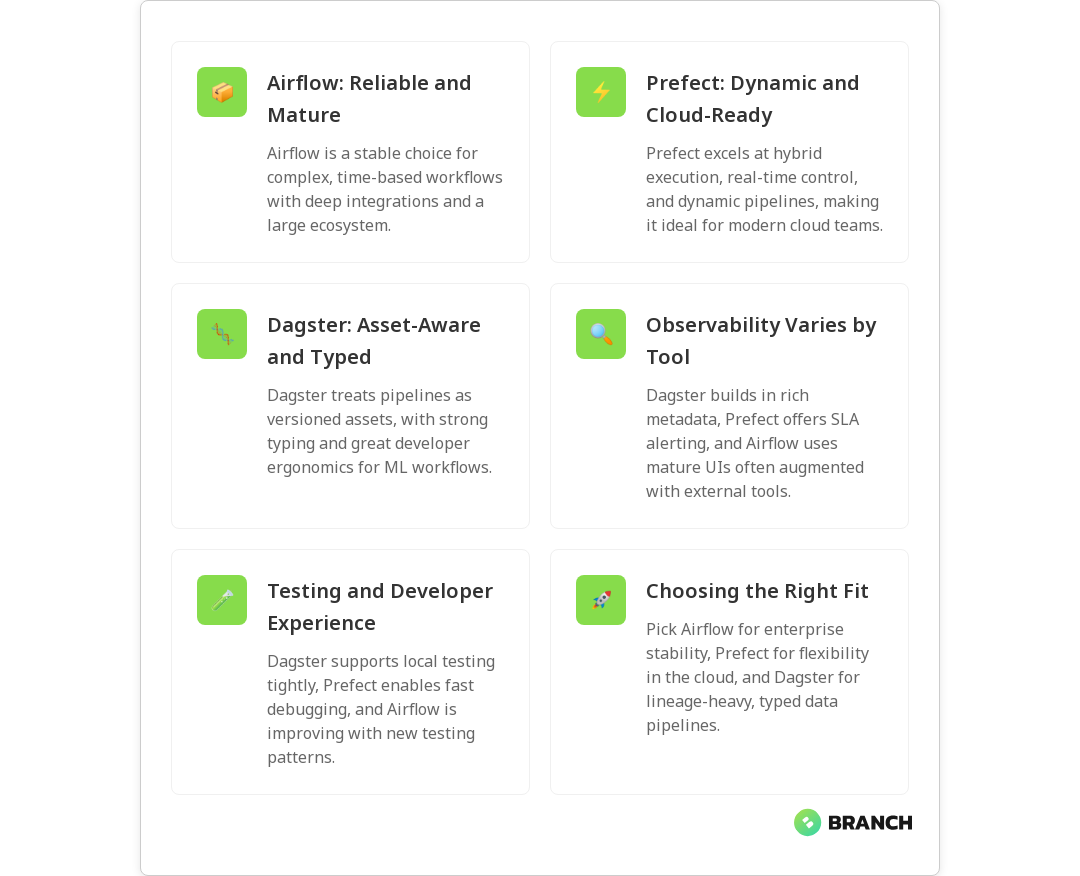
  • Specialized orchestration for data workloads: Frameworks and operators are emerging that focus on ML pipelines, feature stores, and streaming topologies.
  • Portability and standards: Kubernetes remains the common denominator for portability across cloud providers, reducing vendor lock-in concerns.

If you want a simple walk-through of Kubernetes adoption and why organizations are choosing it for reliability and security, MarutiTech’s guide on Kubernetes adoption provides practical context (MarutiTech: Kubernetes adoption).

Read more: Custom Software Development – to understand how containerized services fit into larger software architectures and product roadmaps.

FAQ

What is container orchestration?

Container orchestration is the automated management of containerized applications across clusters. It handles deployment, scaling, networking, health checks, and lifecycle management so apps run reliably without manual intervention.

How is Kubernetes different from Docker?

Docker is mainly for building and running containers. Kubernetes is an orchestration platform that manages containers at scale across multiple nodes. Teams typically use Docker to create images and Kubernetes to deploy and manage them in production.

What is Docker Swarm vs Kubernetes?

Docker Swarm is Docker’s built-in clustering and orchestration tool, simpler for small clusters. Kubernetes is more feature-rich and extensible, offering advanced scheduling, self-healing, and a large ecosystem, making it the dominant choice for complex workloads.

What is an advantage of using Kubernetes for container orchestration?

Kubernetes automates at scale: it provides self-healing, horizontal scaling, rolling updates, and service discovery. Together, these enable resilient, highly available pipelines without constant manual work.

What are the alternatives to Kubernetes?

Alternatives include Docker Swarm (simpler needs), Apache Mesos (large-scale systems), and serverless/container services like Google Cloud Run or AWS Fargate that abstract cluster management. Splunk’s overview provides a useful comparison.

💡 Tip: Don’t pick tools for popularity — pick them because they solve your constraints and let you iterate. Popularity helps with ecosystem support, but fit matters more.

Container orchestration is not a silver bullet, but when matched to your team’s needs and maturity, it gives data engineering teams the capacity to scale, recover, and deliver data products reliably. Start small, automate often, and remember: containers make reproducibility easy, orchestration makes reliability sustainable — and both together keep data pipelines moving without you having to fight fires at midnight.

dataworkflow-image-blog

Workflow Orchestration vs Traditional Job Scheduling in Data Pipelines

Data pipelines keep modern businesses humming — ingesting, transforming, and delivering data that teams and models rely on. But not all pipeline automation is created equal: classic job schedulers and modern workflow orchestration tools solve related problems in different ways. In this article you’ll learn the practical differences, why they matter for reliability and scale, and how to choose the right approach for your data environment.

We’ll walk through core concepts, common patterns, operational trade-offs, and real-world tips you can use when designing or modernizing pipelines. Expect clear comparisons, a few helpful metaphors, and one or two mildly nerdy jokes.

Why this distinction matters

Traditional job scheduling (think cron or enterprise schedulers) triggers tasks at set times. Workflow orchestration coordinates multi-step, dependent tasks and reacts to events, failures, and changing resource needs. The difference affects resilience, observability, and how quickly you can ship data products like analytics, features, or ML models.

In short: if your pipelines are simple and time-based, a scheduler might be fine. If you need conditional logic, retries, parallelism, or environment promotion, orchestration often saves time and headaches.

Read more: Data Engineering for AI – why robust pipelines are foundational for AI and how orchestration plays a role.

What traditional job scheduling gets right

Traditional job schedulers are mature and familiar. They excel at:

  • Time-based execution (daily, hourly, cron expressions).
  • Simple dependency ordering in some enterprise schedulers (run job B after job A completes).
  • Low operational overhead for small teams and straightforward tasks.
  • Predictable behavior and often tight integration with existing enterprise systems.

However, they start to creak when you add complex branching, dynamic inputs, or the need for runtime scaling. That’s where modern orchestration shines.

What workflow orchestration adds

Workflow orchestration treats pipelines as composed graphs of tasks with explicit dependencies, conditional branches, retries, and observability. Orchestrators like Apache Airflow popularized the “jobs-as-code” pattern where pipelines are defined in code, versioned, and tested.

Key capabilities include:

  • Directed acyclic graph (DAG) modeling of task dependencies and conditional paths.
  • Event-driven triggers (file arrival, message queues, external APIs).
  • Automated retries, backoff strategies, and fine-grained failure handling.
  • Integration with dynamic resource managers and cloud services for scaling.
  • Visibility into pipeline state and runtime metrics for debugging and SLAs.

For a concise primer on these distinctions, see this practical guide to data orchestration and workflows from Orchestra.

Orchestra guide explains how orchestration tools enable more robust ETL and ML pipelines through event-driven and error-handling patterns.

Side-by-side: Practical differences

Here’s a quick comparison to ground the theory.

  • Trigger model: Schedulers = time-based; Orchestrators = time + event + API-driven.
  • Complexity: Schedulers = linear or simple DAGs; Orchestrators = complex DAGs, conditional logic, dynamic task generation.
  • Failure handling: Schedulers = job-level failure notifications; Orchestrators = retries, partial recoveries, granular checkpoints.
  • Observability: Schedulers = logs; Orchestrators = rich dashboards, lineage, metrics.
  • Deployment & testing: Schedulers = config-driven; Orchestrators = code-driven (better for CI/CD).

For an enterprise perspective that distinguishes job scheduling from broader workload automation, BMC’s overview is a solid read.

BMC blog highlights how orchestration and workload automation expand on classic scheduling with environment promotion and multi-cloud management.

💡 Tip: Start by mapping your current pipeline: note triggers, dependencies, runtimes, SLAs, and pain points. That map reveals if you truly need orchestration or just smarter scheduling.

When traditional scheduling is enough

Use a scheduler when:

  • Your pipelines are mostly time-based (e.g., nightly ETL jobs) with simple dependencies.
  • Low operational complexity is a priority and teams are small.
  • Jobs are idempotent, long-running state isn’t required, and failures can be retried manually.
  • Cost is a concern and you want to avoid the overhead of a new orchestration platform.

Schedulers are a perfectly valid choice for many organizations. The key is recognizing the breakpoint where manageability costs exceed tool simplicity.

When orchestration is the better choice

Consider orchestration when:

  • Pipelines have many steps, branches, or conditional logic.
  • You need event-driven execution (e.g., process data as it arrives) or sub-hour SLAs.
  • You want reproducibility through “jobs-as-code”, CI/CD promotion, and versioning.
  • Granular failure recovery (resume from a checkpoint) or parallel processing is critical.
  • You need visibility into task lineage and metrics for debugging and compliance.

Orchestration shines in modern data platforms that serve analytics, product features, and ML systems where downtime or data quality issues are costly.

Read more: Data Engineering Services – how we design pipelines and why orchestration often becomes essential when building reliable data infrastructure.

Implementation strategies and best practices

Moving from a scheduler to an orchestrator — or introducing orchestration for the first time — is a project, not just a configuration change. Here are pragmatic steps:

  1. Inventory and categorize jobs: Which are simple, which are complex, which are critical?
  2. Start small: Port a non-critical pipeline to orchestration as a pilot to validate patterns and workflows.
  3. Adopt jobs-as-code: Store DAGs/workflows in version control and integrate with CI/CD for testing and promotion.
  4. Design for idempotency and retries: Ensure tasks can be safely re-run and partial failures are manageable.
  5. Instrument observability: Metrics, logs, and lineage make debugging and SLA tracking possible.
  6. Plan cost and resource management: Orchestration often enables dynamic scaling, but that requires governance.

For guidance on pipeline-level concerns like failure recovery and dynamic allocation, see this practical overview of data orchestration capabilities.

Integrate.io guide discusses granular failure recovery and scalable orchestration infrastructure.

💡 Tip: When testing orchestration, simulate real failures — network issues, partial corruption, throttling — not just the happy path.

Common challenges and pitfalls

Migrating to orchestration introduces some new operational realities:

  • Complexity creep: Orchestrators give power, and power can lead to overly complex DAGs. Favor modular tasks and simple DAGs over monoliths.
  • Resource sprawl: Dynamic scaling can increase cloud costs if not monitored and governed.
  • Operational overhead: Running and securing an orchestration platform requires expertise and runbooks.
  • Testing and observability gaps: Code-driven workflows need robust testing and monitoring frameworks to avoid unexpected behavior.

Address these by enforcing coding standards for DAGs, automated tests, cost-monitoring alerts, and role-based access controls.

Read more: Cloud Infrastructure Services – for guidance on cost optimization and governance when running orchestrators in cloud environments.

Trends and what’s next

Workflow orchestration is evolving quickly. A few trends to watch:

  • Event-driven and real-time orchestration: As streaming use cases grow, orchestrators will increasingly support event-first patterns.
  • Jobs-as-Code + GitOps: CI/CD for workflows is becoming standard, enabling safer promotion across environments.
  • Hybrid and multi-cloud orchestration: Tools and patterns that abstract cloud differences are gaining traction for portability.
  • Integration with ML lifecycle tools: Orchestration layers are more tightly integrating model training, validation, and deployment.

For a high-level view on end-to-end orchestration including ETL, streaming, and model deployment, Rivery’s guide offers a useful framework.

Rivery orchestration guide covers end-to-end patterns and considerations for production data flows.

💡 Tip: Choose the right level of orchestration. Not every team needs a full Airflow cluster. Start with a clear problem, then match the tool to the use case.

Choosing the right tool — practical checklist

  • Do you need event-driven triggers or just time-based jobs?
  • Are pipelines simple or do they require branching, parallelism, and retries?
  • Does your team have the skillset to maintain a workflow platform, or would managed services be preferable?
  • How important are observability, lineage, and reproducibility for audits and debugging?
  • What are your cost constraints and cloud governance requirements?

Answering these questions will help you pick between lightweight schedulers, managed orchestrators, or self-hosted platforms.

Read more: Custom Software Development – if you need bespoke pipeline integrations, custom tooling, or CI/CD automation as part of your orchestration strategy.

FAQ

What is meant by workflow orchestration?

Workflow orchestration is the automated coordination and management of interdependent tasks in a data pipeline, application process, or ML lifecycle. It manages sequencing, conditional logic, retries, error handling, and triggers to ensure workflows run reliably and transparently.

What are workflow orchestration tools?

Workflow orchestration tools are platforms that let you define, schedule, monitor, and retry complex workflows. Examples include Apache Airflow, Prefect, and commercial managed services. These tools provide DAG modeling, observability, and integrations with cloud systems.

What is the difference between ETL and workflow orchestration?

ETL describes the extract-transform-load pattern for moving and shaping data. Workflow orchestration coordinates the steps that make up ETL and other processes. Think of ETL as the work, and orchestration as the conductor ensuring the orchestra plays in sync and handles missed cues.

Is Apache Airflow a workflow orchestration tool?

Yes. Apache Airflow is a widely used workflow orchestration platform that models pipelines as DAGs in code, supports scheduling and event triggers, and provides monitoring, retries, and integrations for cloud and on-prem systems.

What are the components of workflow orchestration?

Typical components include a scheduler/executor, a metadata and state store (for tracking task status), a user interface and API, integrations/connectors for data and compute, and logging/metrics for observability. Advanced setups also add authentication, RBAC, and CI/CD deployment pipelines.

Read more: AI Development Services – orchestration is especially important when operationalizing AI and ML models, from training to deployment and monitoring.

Whether you stick with a scheduler or adopt a full orchestration platform, the goal is the same: deliver reliable, observable, and maintainable pipelines that let your teams move faster. If you want help mapping your current state and choosing a path forward, we’d love to chat and share battle-tested patterns (and possibly a few more nerdy jokes).

largelanguagemodels-image-blog

What LLMOps Is (and Why It’s the Next Evolution of MLOps)

Large language models (LLMs) have gone from research curiosities to business-critical tools almost overnight. As companies race to build chatbots, assistants, and content engines, the operational question becomes: how do you manage these powerful but complex systems reliably and responsibly? This article explains LLMOps — the emerging practices and tooling tailored for LLMs — why it matters, how it differs from traditional MLOps, and practical steps your team can take to deploy LLMs at scale.

Why LLMOps matters now

LLMs bring new capabilities — fluent generation, long-form reasoning, and multimodal inputs — but they also introduce unique operational challenges. Model sizes, latency sensitivity, prompt drift, safety risks, and costly fine-tuning all mean the old MLOps playbook needs an upgrade. Organizations that treat LLMs like smaller machine learning models risk outages, hallucinations, privacy breaches, and ballooning cloud bills.

LLMOps is the discipline that stitches together lifecycle automation, monitoring, governance, and infrastructure optimization specifically for LLMs. For a solid overview of LLM-specific lifecycle automation and best practices, see the practical guide from Red Hat.

LLMOps vs. MLOps: what’s really different?

On the surface, both LLMOps and MLOps cover data, training, deployment, and monitoring. The differences show up when you dig into the details:

  • Model interaction: LLMs are often interacted with via prompts and embeddings rather than fixed feature pipelines. Managing prompt engineering and prompt versioning is unique to LLMOps.
  • Cost & scale: LLM inference and fine-tuning can be orders of magnitude more expensive than traditional models, pushing teams to optimize for caching, batching, and model selection.
  • Observability: Instead of only numeric metrics, LLMOps needs behavioral monitoring — e.g., hallucination rates, toxic output, and alignment regressions.
  • Governance & safety: Human-in-the-loop moderation, red-teaming, and content filters are first-class concerns, not afterthoughts.

For a side-by-side comparison and guidance on operational best practices tailored to LLMs, Google Cloud’s explainer on the LLMOps lifecycle is a useful resource: What is LLMOps.

Key aspects of LLMOps

LLMOps pulls together a set of practices that support safe, reliable, and cost-effective LLM production systems. Some of the core aspects include:

  • Prompt and instruction management: Versioning prompts and templates, A/B testing phrasing, and capturing contextual signals used at inference time.
  • Data curation for fine-tuning and retrieval: Building clean, representative datasets for supervised fine-tuning and retrieval-augmented generation (RAG) indexing.
  • Model lifecycle automation: Pipelines for fine-tuning, evaluation, deployment, and rollback specific to large models.
  • Observability and metrics: Monitoring latency, cost per request, content quality metrics (e.g., hallucination rate), and user satisfaction signals.
  • Infrastructure orchestration: Specialized hardware management (GPUs/TPUs), model sharding, and cost-aware serving strategies.
  • Safety, governance, and compliance: Prompt redaction, PII detection, access controls, and audit trails for model outputs.

Wandb’s article on understanding LLMOps provides a practical look at development and deployment tools tailored for LLMs and how LLMOps extends MLOps practices in real projects: Understanding LLMOps.

💡 Tip: Treat prompts, retrieval indexes, and post-processing as first-class artifacts. Version them, test them, and include them in CI to avoid “works in dev, fails in prod.”

LLMOps lifecycle: practical stages

The LLMOps lifecycle is similar to MLOps in shape but different in content. A practical lifecycle might look like this:

  1. Discovery & sourcing: Identify use cases and collect domain-specific datasets and knowledge sources for retrieval augmentation.
  2. Prototyping: Rapidly iterate with small-scale tests, prompt experiments, and hybrid approaches (e.g., API + local cache).
  3. Fine-tuning & evaluation: Fine-tune when necessary; otherwise focus on RAG and prompt engineering. Use human evaluation and automated behavioral tests.
  4. Deployment & serving: Choose between hosted APIs, managed services, or self-hosting. Implement caching, model selection, and latency optimization.
  5. Monitoring & feedback: Track both system performance and content quality. Feed user feedback into retraining or prompt adjustments.
  6. Governance & iteration: Maintain access controls, audit logs, and safety checks. Iterate based on business needs and risk assessments.

Red Hat emphasizes lifecycle automation and continuous iteration for LLMs — automating as much of this sequence as possible reduces human error and improves reliability: LLMOps lifecycle automation.

Strategies to run LLMs effectively in production

Operationalizing LLMs requires a mix of engineering, data work, and governance. Here are practical strategies to adopt:

  • Hybrid inference architecture: Use a mix of smaller, cheaper specialized models for routine tasks and larger models when high quality or deeper reasoning is needed. This reduces cost and improves responsiveness.
  • Retrieval-augmented generation (RAG): Augment LLM output with vetted knowledge stores. RAG often delivers safer, more accurate responses than blind generation and reduces model fine-tuning needs.
  • Prompt testing and canary rollouts: Treat prompt changes like code changes — test and roll out gradually while monitoring key behavioral metrics.
  • Human-in-the-loop for safety: Route high-risk or ambiguous outputs for human review, especially in regulated domains like healthcare or finance.
  • Cost observability: Track per-request compute and storage costs; use autoscaling, batching, and request prioritization to control spend.

PagerDuty’s guide to LLMOps highlights governance frameworks and operational performance optimization for running LLMs reliably, which is helpful when designing incident and escalation plans: LLMOps governance.

Read more: Data Engineering AI – Understand why high-quality, well-architected data pipelines are essential for reliable LLM performance.

Challenges you’ll face (and how to approach them)

LLM projects can fail for technical and organizational reasons. Here are common pitfalls and how to mitigate them:

  • Hallucinations and factual errors: Mitigation: RAG, grounding, and post-generation verification checks.
  • Data privacy and compliance: Mitigation: PII detection, prompt redaction, and secure retrieval stores with access controls.
  • Model drift and prompt decay: Mitigation: Continuous evaluation, user feedback loops, and scheduled retraining or prompt updates.
  • Cost overruns: Mitigation: Mixed model sizes, caching common responses, and careful autoscaling rules.
  • Tooling gaps: Mitigation: Combine MLOps platforms with LLM-specific tooling (prompt stores, RAG orchestrators) and invest in custom automation when needed.

Many teams find that evolving their CI/CD and monitoring pipelines to incorporate behavioral tests and safety checks is the most productive early investment. CircleCI’s write-up on the evolution from MLOps to LLMOps discusses orchestration and governance considerations that are useful when planning automation: From MLOps to LLMOps.

Read more: Tailored AI Solutions – Learn why a one-size-fits-all approach fails for enterprise LLM projects and how to design tailored solutions.

Emerging trends and tooling

The LLMOps ecosystem is maturing fast. Expect developments in:

  • Prompt stores and version control: Tools to store, diff, and roll back prompts and injection patterns.
  • Behavioral testing frameworks: Suites that test for hallucinations, bias, toxicity, and alignment drift.
  • Model orchestration platforms: Systems that select models dynamically based on cost, latency, and requested capability.
  • Hybrid hosting options: More flexible choices between cloud-hosted models and on-prem/self-hosted deployments for compliance-sensitive workloads.

Google Cloud’s material on LLMOps emphasizes real-time performance monitoring and data management, both of which are increasingly important as LLMs move into live user-facing systems: Real-time LLMOps guidance.

Read more: AI Development Services – Find practical services and consulting approaches to implement responsible AI and LLM projects.

Best practices checklist

  • Version prompts, embeddings, and retrieval indexes alongside code and models.
  • Use RAG to ground responses and reduce hallucinations before committing to fine-tuning.
  • Instrument behavioral metrics (hallucination rate, toxicity, customer satisfaction) and tie them into alerting.
  • Implement gradual rollouts and canaries for prompt and model changes.
  • Include human review for high-risk outputs and maintain audit logs for compliance.
  • Optimize serving architecture for cost and latency: caching, sharding, and mixed-model strategies.
Read more: Data Engineering Services – Explore how building resilient data pipelines supports accurate retrieval and fine-tuning for LLMs.

FAQ

What does LLMOps stand for?

LLMOps means Large Language Model Operations. It refers to practices, tooling, and processes for deploying and managing LLMs in production.

What is the difference between LLMOps and MLOps?

LLMOps extends MLOps to cover prompt management, retrieval augmentation, behavioral monitoring, and governance tailored for large language models.

What are the key aspects of LLMOps?

Key aspects include prompt versioning, RAG data curation, lifecycle automation, cost and latency optimization, and safety/governance frameworks.

What is the life cycle of LLMOps?

The LLMOps lifecycle spans discovery, prototyping, fine-tuning or retrieval design, deployment, monitoring, and governance with automation at each step.

What are the best practices for LLMOps?

Best practices include versioning prompts, using RAG, monitoring behavioral metrics, canary rollouts, human review for risky outputs, and cost-aware serving.

Closing thoughts

LLMOps is not a buzzword — it’s a pragmatic evolution that recognizes LLMs are different beasts than traditional models. Investing in LLMOps practices early will make your LLM projects more reliable, safer, and more cost-effective. Start with strong data pipelines, versioned prompts, RAG strategies, and behavioral monitoring; then iterate toward automation and governance. If you’re building business systems with LLMs, LLMOps is the discipline that turns experimental demos into dependable products.

For teams ready to go beyond experimentation, combining solid data engineering, responsible AI development practices, and cloud-native infrastructure will accelerate success. If you want help designing that roadmap, Branch Boston offers services that cover data engineering, AI development, and cloud solutions tailored to enterprise needs.

datahealthmonitoring-image-blog

What Data Observability Is (and How It Prevents Data Disasters)

Data observability is the practice of understanding the internal health of your data systems by monitoring their signals — think of it as the health tracker for your data pipelines. It matters because as businesses scale, small data issues become big business headaches: wrong reports, broken ML models, and decisions based on garbage. In this article you’ll learn what data observability actually means, the practical pillars teams rely on, how to implement it without sending your engineers into alert-fatigue, and how it protects you from full-on data disasters.

What is data observability?

At its core, data observability is about turning signals from your data ecosystem into meaningful insights. Rather than reacting when someone spots a bad dashboard, observability helps you detect anomalies, trace problems to their root cause, and recover faster. It’s closely related to monitoring, but broader — focusing on the health of data as a product (completeness, freshness, distribution, volume, and lineage) rather than just system uptime. For a good overview of the concept and its pillars, see the primer from IBM on data observability.

Observability borrows ideas from software observability (metrics, logs, traces) and applies them specifically to data: telemetry about tables, pipelines, schemas, and model inputs. That’s why engineering, analytics, and product teams often collaborate closely when building observability into the data stack. If you want the deep-dive on pillars and lineage, Splunk’s guide is a useful read: Splunk on data observability.

Why data observability matters — and what’s at risk

Imagine a pricing algorithm that suddenly gets stale input data, or a marketing dashboard using an incomplete customer table. Those aren’t theoretical problems — they impact revenue, trust, and operational speed. Data observability helps you catch signs of data sickness early: increased nulls, skewed distributions, missing daily loads, or unexpected schema changes.

When observability is absent, teams spend a lot of time firefighting: chasing where an error started, validating assumptions, or rolling back models. With observability, incident detection, diagnosis, and resolution become proactive and measured — reducing time-to-repair and preventing knock-on issues. IBM explains how observability supports incident diagnosis and system health monitoring, which is central to preventing serious outages: IBM’s explanation.

💡 Tip: Start by defining the most business-critical datasets and model inputs. Observability is expensive to instrument everywhere — prioritize the pipelines that would cause real harm if they failed.

The pillars (and a practical way to think about them)

Different vendors and thought leaders phrase pillars differently — some list five, some four — but they converge on the same practical needs. Monte Carlo and other modern analyses emphasize pillars like freshness, volume, distribution, schema, and lineage. Here’s a practical breakdown you can use when planning:

  • Freshness and availability: Is the data arriving on time? Missing daily loads or delays are often the first sign of trouble.
  • Quality and distribution: Are values within expected ranges? Are nulls or outliers spiking?
  • Volume and cardinality: Sudden drops or surges in row counts or unique keys often indicate upstream failures or logic bugs.
  • Schema and structure: Are new columns appearing or types changing unexpectedly?
  • Lineage and traceability: Can you follow a faulty record back through the pipeline to the source system?

Splunk outlines how lineage and real-time monitoring together enable faster root-cause analysis and predictive detection: Splunk’s guide. Monte Carlo also emphasizes AI-powered anomaly detection and automated root-cause analysis as emerging best practices: Monte Carlo’s perspective.

How data observability works — in plain engineering terms

Implementing observability is a mix of instrumentation, automation, and team processes.

  1. Instrument your sources: Emit metrics for pipeline runs, table row counts, schema hashes, and load durations. These are your raw signals.
  2. Collect telemetry: Aggregate logs, metrics, and record-level metadata into a central place so you can correlate signals across systems.
  3. Detect anomalies: Use rule-based checks and machine learning models to flag deviations from expected behavior.
  4. Trace lineage: Map how data moves through ETL jobs, transformations, and downstream models so you can follow an issue to its origin.
  5. Automate alerts and runbooks: Send actionable alerts with context (what changed, recent runs, sample bad records) and link to runbooks for triage.
  6. Feedback loop: Capture incident outcomes to refine checks and reduce false positives over time.

For how observability supports disaster recovery through metrics, logs, and traces, see this practical explanation from Milvus: Milvus on disaster recovery.

Read more: Data Engineering for AI – Reliable data pipelines are the foundation for effective observability and trustworthy AI outcomes.

Strategies to prevent data disasters (step-by-step)

Preventing data disasters is less about expensive tools and more about smart priorities and repeatable practices. Here’s a pragmatic roadmap your team can use:

  • Inventory and classification: Know what datasets you have, where they’re used, and which are business-critical.
  • Implement lightweight checks: Start with row counts, null rates, and freshness checks on critical tables. Expand later.
  • Establish lineage: Use metadata tools to map dependencies so you can answer “what will break if this table fails?” quickly.
  • Contextual alerts: Send alerts that include recent metrics, sample records, and links to dashboards and runbooks.
  • On-call practices: Rotate ownership, document runbooks, and review incidents to prevent recurrence.
  • Use ML where it helps: Anomaly detection can reduce noise by prioritizing the most suspicious deviations, but start with deterministic checks before layering ML.
💡 Tip: Don’t try to observe everything on day one. Instrument the top 10% of datasets that drive 90% of decisions — it delivers the biggest risk reduction for the least effort.
Read more: Tailored AI Solutions – Observability ensures the high-quality data that AI systems need for accurate predictions and safe automation.

Common challenges and how to overcome them

Teams run into a handful of repeatable obstacles when building observability:

  • Alert fatigue: Too many noisy checks create false alarms. Fix by tuning thresholds, batching similar anomalies, and prioritizing critical datasets.
  • Blind spots in lineage: Without accurate lineage, root-cause analysis stalls. Invest in metadata capture and automated lineage tracing where possible.
  • Ownership ambiguity: If no one owns a dataset, it’s unlikely to be observed well. Assign data owners and make SLAs explicit.
  • Tool sprawl: Multiple monitoring tools with fragmented signals slow diagnosis. Consolidate telemetry or integrate tools to provide a single pane of view.

Collibra’s take on maintaining data system health stresses monitoring, tracking, and proactive troubleshooting as key activities — essentially the antidote to these challenges: Collibra on defining data observability.

Read more: Data Engineering Services – Strong engineering practices make observability easier by standardizing pipelines and data contracts.

Tools and automation — what to look for

The market has specialized observability platforms, pipeline-focused tools, and general-purpose monitoring systems. When evaluating tools, prioritize:

  • Automated lineage and easy integration with your data stack.
  • Flexible rules and built-in anomaly detection (with explainability).
  • Actionable alert context (sample bad records, diffs, and recent job runs).
  • Good metadata management and collaboration features so analysts and engineers can share context.

Monte Carlo and Splunk both highlight automation and predictive analytics as growing trends; automation reduces mean-time-to-detect and mean-time-to-repair, and predictive signals help avoid incidents before they escalate: Monte Carlo and Splunk.

Read more: Cloud Cost Strategies – Observability helps control cloud costs by spotting inefficiencies in pipelines and storage early.

Trends to watch

Watch for these evolving trends in data observability:

  • AI-assisted root cause analysis: Tools are getting better at suggesting the most probable causes and the minimal set of failing components.
  • Record-level lineage: Tracing not just tables but individual records through transformations is becoming more feasible and valuable for debugging.
  • Observability-as-code: Defining checks, alerts, and SLAs in version-controlled pipelines to keep observability reproducible and auditable.
  • Cross-team SLAs: Product, analytics, and engineering teams formalize dataset contracts so ownership is clear and expectations are aligned.

FAQ

What is meant by data observability?

Data observability is the practice of collecting telemetry (metrics, logs, metadata) from pipelines and systems to monitor health, detect anomalies, trace lineage, and resolve issues quickly. It treats data as a product with a focus on availability, quality, and traceability. IBM on data observability

What are the 4 pillars of data observability?

Common pillars include freshness, distribution (quality), volume, and schema. Many frameworks add lineage as a fifth pillar for tracing the origin of issues. Splunk’s pillars

What are the use cases of data observability?

Use cases include early detection of ingestion failures, preventing bad data from reaching dashboards, faster root-cause analysis, automated alerting, and improved confidence in ML outputs. It also supports disaster recovery. Milvus on disaster recovery

What is the difference between data observability and data monitoring?

Monitoring uses predefined checks and dashboards to confirm uptime or thresholds. Observability is broader: it leverages signals (metrics, logs, metadata) to understand behavior and diagnose new, unseen issues without extra instrumentation.

How does data observability work?

It works by instrumenting data flows to emit telemetry (counts, schemas, runtimes), collecting it centrally, applying anomaly detection, and mapping lineage for traceability. Alerts and runbooks speed resolution. Tools like Monte Carlo and Collibra provide practical implementations.

💡 Tip: Pair observability with documented runbooks and incident reviews. Tools show what broke; runbooks explain what to do next and how to prevent repeat issues.

Closing thoughts

Data observability isn’t a magic wand, but it’s one of the highest-leverage investments a data-driven organization can make. It reduces downtime, protects revenue and reputation, and returns time to engineers and analysts who would otherwise be stuck in perpetual triage. Start small, focus on critical datasets, and build processes around the signals your systems provide — you’ll avoid data disasters and sleep a little easier at night.

Read more: Technology Services Overview – A broad look at how technology services, including observability, strengthen resilience and reliability.
dataorchestration-image-blog

Apache Airflow vs Prefect vs Dagster: Modern Data Orchestration Compared

Data orchestration is the invisible conductor that keeps data pipelines playing in harmony — and choosing the right conductor matters. Whether you’re running nightly ETL, powering ML feature stores, or wiring data for real-time analytics, the orchestrator you pick affects developer productivity, reliability, and long-term maintenance. In this article we’ll compare Apache Airflow, Prefect, and Dagster across design philosophies, developer experience, scheduling and execution models, observability, and real-world fit. By the end you’ll have practical guidance on which tool to try first and what to watch for during adoption.

Why data orchestration matters

Orchestration does more than kick off jobs at specific times. It manages dependencies, retries failures intelligently, coordinates across systems, and feeds observability into the teams that run it. As organizations scale, orchestration becomes the spine of reliable data delivery — one wrong scheduling quirk can delay reports, break models, or cause production outages.

💡 Tip: Don’t treat an orchestrator as just a scheduler. Evaluate how it surfaces metadata (who ran what, with which inputs), how it supports versioning, and how easy it is to test locally before deploying to production.

Quick primer: What each tool brings to the table

  • Apache Airflow — Mature, battle-tested, and community-backed. Airflow excels at complex static DAGs, deep integration with diverse systems, and proven production deployments. It’s a safe default for heavy scheduling needs, though it can feel heavyweight for dynamic or asset-centric workflows.
  • Prefect — Modern, cloud-friendly, and API-driven. Prefect emphasizes dynamic flows, hybrid execution, and runtime control (think circuit-breakers and real-time SLA alerting). It often delivers faster developer iteration for cloud-native teams and supports both local and managed control planes.
  • Dagster — Developer-first and asset-aware. Dagster treats pipelines as versioned assets and focuses on strong typing, local development ergonomics, and observability for metadata. It’s a strong contender for ML pipelines and teams who want explicit tracking of data assets rather than just tasks.

These summaries align with recent comparisons that highlight Airflow’s stability, Prefect’s dynamic execution model, and Dagster’s asset-based approach (see the risingwave comparison and the getgalaxy guide).

Key differences that affect day-to-day work

1) Static DAGs vs dynamic flows vs assets

Airflow centers on DAGs defined as code — great for predictable, repeatable jobs. Prefect gives you dynamic flows where runtime decisions, mapping, and stateful control are easier. Dagster reframes pipelines around assets, which is useful when you care about the lineage and versioning of datasets and model artifacts rather than just task success.

2) Developer experience and testing

Dagster emphasizes local development and testability with a tight feedback loop, while Prefect’s Pythonic API and interactive REPL-style debugging make iteration quick. Airflow historically required more CI and operational scaffolding for testing, though newer patterns and plugins have improved the local dev story.

💡 Tip: Try a small PoC pipeline end-to-end: local authoring, unit tests, deployment, and an intentional failure. The tool that surfaces fixes fastest is often the team’s best friend.

3) Scheduling, execution, and scaling

Airflow is strong on cron-like scheduling, backfills, and complex dependency windows. Prefect supports hybrid execution models so sensitive tasks can run on-prem while the control plane is hosted. Dagster focuses on sensible parallelism around assets and can scale with Kubernetes executors. If your use case includes heavy real-time or very high concurrency workloads, verify the execution model under load.

4) Observability and metadata

Observability is where preferences diverge. Airflow provides mature UI and logging, but teams often augment it with external monitoring. Dagster builds metadata and lineage into its core, making it easier to answer “which dataset changed?” Prefect provides runtime introspection and SLA alerting, which is handy for detecting anomalies during execution (see the practical comparisons in the zenml showdown).

When to choose each orchestrator

  • Choose Airflow if you have many existing integrations, need complex time-based scheduling, or require a mature ecosystem for enterprise use. Airflow is the conservative, reliable choice for production-grade DAGs.
  • Choose Prefect if you want an API-driven, cloud-friendly orchestrator that supports dynamic flows and hybrid execution. It’s great for teams building modern pipelines that need runtime control and simple orchestration for cloud services.
  • Choose Dagster if you’re building ML pipelines, care deeply about asset lineage and versioning, and want a pleasant developer experience with strong local testing and typed IO.
Read more: Data Engineering AI – explains how solid pipelines and orchestration are foundational for AI and ML projects.

Migration and hybrid strategies

Moving orchestrators isn’t trivial, but it’s doable with a balanced approach. Consider running both systems in parallel during a migration — keep critical DAGs in the stable orchestrator while gradually porting pipelines to the new system. Focus first on idempotent tasks and data assets that have clear inputs and outputs. Use adapters or small wrapper operators to maintain compatibility with external systems during transition.

Read more: Data Engineering Services – practical help for building resilient pipelines and orchestrations when migrating or scaling.

Costs, ops, and ecosystem

Open-source and cloud-managed offerings change the total cost of ownership. Airflow distributions (Apache Airflow, Astronomer, Managed Airflow) and community operators give diverse deployment options. Prefect offers a managed cloud control plane plus an open-source core, while Dagster also has a hosted option and an opinionated open-source framework. Consider the operational skillset on your team and whether hosting, managed control planes, or vendor support match your compliance posture.

Common challenges and how to manage them

  1. Dependency sprawl: Large DAGs or complex asset graphs can become brittle. Break DAGs into smaller, testable units and prefer explicit asset definitions when possible.
  2. Observability gaps: Missing metadata makes debugging slow. Standardize logging, add lineage capture, and wire orchestration alerts into your incident channels.
  3. Testing pipelines: Write unit tests for task logic and integration tests for orchestration behavior. Leverage local execution modes provided by Prefect and Dagster to iterate quickly.
  4. Team buy-in: Migration is as much cultural as technical. Run brown-bag sessions, document patterns, and create starter templates for common pipeline types.
Read more: Cloud Infrastructure – guidance on choosing cloud-hosting and security models that interplay with orchestrator choices.

Trends to watch

  • Asset-first orchestration is growing, especially for ML and analytics teams that need lineage and dataset versioning.
  • Hybrid execution and zero-trust designs will shape how teams run sensitive tasks on-prem while using cloud control planes for coordination.
  • Stronger developer ergonomics and local testing support will tilt new projects toward tools that reduce friction in iteration cycles.

FAQ

What is data orchestration vs ETL?

Data orchestration is the coordination layer that manages when, where, and how data tasks run and how their outputs flow between systems. ETL (extract, transform, load) is a specific pattern of data movement and transformation. Orchestration manages ETL jobs along with other tasks like model training, monitoring, and downstream notifications — think of ETL as a cargo train and orchestration as the railroad network and timetable.

What is the difference between data orchestration and data integration?

Data integration focuses on combining data from different sources into a coherent target (for example, a data warehouse), often handling schema mapping and transformation. Orchestration focuses on scheduling, dependency management, retries, and the logic that runs those integration tasks. Integration is about the data; orchestration is about when and how integration jobs execute.

What is the best data orchestration tool?

There’s no one-size-fits-all best tool. Airflow is often best for complex, time-based production workflows; Prefect shines for cloud-native, dynamic flows; Dagster is excellent when asset lineage and developer ergonomics matter. The best choice depends on your team’s skills, operational constraints, and the nature of your pipelines — pilot each tool with a representative workload before committing.

What is an orchestration framework?

An orchestration framework is a software system that defines, schedules, and monitors workflows. It provides APIs or DSLs for authors to define tasks and dependencies, an execution engine to run work, and UIs or APIs to visualize runs and handle failures. Frameworks may be more opinionated (asset-first) or more general-purpose (task graphs).

What is a data orchestration example?

A common example: a nightly pipeline that extracts sales data from multiple sources, transforms and aggregates it, updates a reporting table in a data warehouse, triggers model retraining if data drift is detected, and alerts stakeholders when thresholds are crossed. The orchestrator manages ordering, retries, parallelism, and notifications across those steps.

streamvbatch-image-blog

What Stream Processing Really Is (and When to Use It Over Batch)

Think of stream processing as the live sports broadcast of data: it delivers plays as they happen, not after the final buzzer. This article explains what stream processing is, why it matters for modern businesses, and how to decide when to choose streaming over traditional batch processing. You’ll get practical patterns, trade-offs to watch for, and a short checklist to help you move from theory to action without pulling your hair out.

Why stream processing matters

Data used to arrive in neat piles — nightly ETL jobs, weekly reports, monthly reconciliations — and batch processing was the unquestioned hero. But businesses increasingly need immediate, continuous insight: fraud alarms the moment a transaction looks suspicious, product recommendations that update as a visitor browses, or sensor alerts from connected equipment. Stream processing turns incoming events into timely decisions, enabling lower latency, better customer experiences, and faster operational response.

For a concise primer on what stream processing entails, Confluent’s introduction is a clear, friendly resource that highlights real-time transformation and common use cases like fraud detection and recommendations.

Core concepts (the parts that make streaming feel like magic)

Here are the foundational ideas you’ll see again and again when working with streams:

  • Events and streams: A stream is an append-only sequence of events (user clicks, sensor readings, log lines). Processing happens continuously as events arrive.
  • Processing time vs event time: Processing time is when the system sees the event; event time is when the event actually happened. Handling late or out-of-order events requires thinking in event time.
  • Windowing: Windows group events into time-bounded sets (sliding, tumbling, session windows) so you can compute aggregates over meaningful intervals.
  • Stateful vs stateless: Some operations (simple transforms) are stateless; others (counts, joins, sessionization) require keeping state across events.
  • Delivery semantics: At-least-once, at-most-once, and exactly-once delivery affect correctness and complexity of downstream logic.
💡 Tip: If your use case needs counts or joins over time (e.g., active users in the last 5 minutes), you’ll almost always need windowing and stateful processing — that’s the sweet spot for stream processors.

When to use stream processing over batch

You don’t always need streaming. Batch is still the right tool for a lot of jobs. Use streaming when latency and continuous updates are core requirements. Here’s a practical decision guide:

  1. Latency matters: If decisions or user experiences depend on sub-second to minute-level freshness (fraud detection, live personalization, operational alerts), pick streaming.
  2. Continuous input: If data arrives continuously and you need ongoing computation rather than periodic snapshots, streaming fits better.
  3. Incremental computation: If you can maintain and update results as events come in rather than recomputing whole datasets, streaming is usually more efficient.
  4. Complex event patterns: Correlating patterns across events over time (like detecting sequences of suspicious actions) favors streaming.
  5. Downstream SLAs: If systems downstream expect near-real-time updates or push notifications, stream-first architectures simplify the flow.

For a side-by-side comparison, GeeksforGeeks provides a straightforward look at batch versus stream processing, including how to choose based on latency needs.

Read more: AI backbone insights – how solid data engineering underpins both batch and streaming architectures for AI systems.

Common streaming architecture patterns

There are a few patterns that keep showing up in real projects. Pick the pattern that best fits your operational constraints and team skills.

  • Event-driven microservices: Services react to streams of domain events. Good for decoupling and scalability.
  • Kappa-style architecture: Treat everything as a stream — even what you used to do in batch — simplifying the stack and avoiding sync between batch and streaming layers.
  • Streaming ETL: Ingest, transform, and route data in real time, then store final or aggregated results in databases or data lakes for serving and analytics.
  • Hybrid (batch + stream): Use streaming for time-sensitive, incremental updates and batch for heavy historical reprocessing or large-scale model training.

Splunk’s overview on stream processing does a great job of explaining how continuous ingestion and low-latency insight drive these architectures in fields like finance and IoT.

Read more: Cloud infrastructure services – because streaming systems often rely on scalable, resilient cloud infrastructure to handle bursts and stateful workloads.

Trade-offs and challenges (the not-so-fun but necessary bits)

Streaming brings power, but also complexity. Expect to trade simplicity for speed in several areas:

  • Operational complexity: Stateful processors, checkpointing, and managing exactly-once semantics require more operational thought than simple batch jobs.
  • Testing and debugging: Reproducing errors in a continuously running system can be trickier than replaying a batch job.
  • Cost model: Continuous compute and storage for state can be more expensive than periodic batch runs — but the business value often justifies it.
  • Data correctness: Handling late-arriving or out-of-order events and ensuring idempotent updates take careful design.
💡 Tip: Invest in observability from day one. Tracing, metrics, and replayable logs (like Kafka topics) make bugs easier to find and fixes safer.

Implementation checklist — practical steps to get started

Here’s a short checklist to move from “we should do streaming” to “we’re reliably running streams in production.”

  1. Define business SLAs: What freshness and correctness guarantees do you need? This controls technology and architecture choices.
  2. Model events: Design clear, versioned event schemas and plan for schema evolution.
  3. Choose your processing model: Stateless transforms vs stateful windowed computations — choose frameworks that support your needs.
  4. Plan for delivery semantics: Decide whether at-least-once is acceptable or if you need exactly-once processing and pick tooling that supports it.
  5. Build observability: Expose metrics, tracing, and retention policies; keep logs replayable so you can reprocess historical data.
  6. Test with production-like data: Simulate out-of-order and late events, run chaos tests for backpressure and failures.
  7. Deploy with CI/CD: Automate deployments and include migration/rollback plans for stateful processors.
Read more: CI/CD & DevOps – best practices for automating delivery and safely rolling out streaming processors and pipelines.

When batch still wins

Batch processing isn’t dead. It’s efficient and simpler for many workloads:

  • Large-scale historical analytics, machine learning training on full datasets, and periodic reporting are great batch candidates.
  • If your business is okay with hourly or daily freshness, batch reduces complexity and cost.
  • Use batch when reproducibility (rebuilding everything exactly from raw data) and peak cost efficiency are primary goals.

GeeksforGeeks provides a helpful side-by-side view so you can map your specific needs to the right approach.

Trends and what’s next

Streaming is moving from niche to mainstream. Key trends to watch:

  • Cloud-native streaming: Managed platforms reduce operational burden and make streaming accessible to teams without deep ops expertise.
  • Convergence of analytics and operational systems: Real-time ML inference and feature updates mean streaming is increasingly part of ML workflows.
  • Better developer ergonomics: Higher-level stream SQL and stream-first frameworks let product teams work faster without sacrificing correctness.

Redpanda’s fundamentals guide and Splunk’s blog both emphasize that real-time insights and operational responsiveness are central to modern businesses’ competitive advantage.

FAQ

What do you mean by stream processing?

Stream processing is the continuous ingestion, transformation, and analysis of data as events arrive, rather than waiting for a complete dataset. It enables low-latency computations like rolling aggregates, pattern detection, and real-time transformations so systems can act on data immediately.

Why is stream processing important?

Many modern business problems require immediate action or continuous updating: fraud prevention, live personalization, and operational monitoring. Stream processing reduces decision latency and can provide near-instant insights that batch systems can’t deliver in time.

Is stream processing real-time?

“Real-time” can mean different things depending on context. Stream processing enables near-real-time or real-time behaviors (sub-second to seconds latency), but actual latency depends on system design, infrastructure, and processing complexity. For details on common use cases and latency considerations, Confluent’s primer is a good practical resource.

How is stream processing different from traditional data processing?

Traditional (batch) processing collects data over a period, then processes it in bulk. Stream processing handles data continuously as it arrives. The difference shows up in latency, architecture complexity, state management, and cost profiles. Batch is easier to reason about and cheaper for infrequent jobs; streaming is necessary when timeliness and incremental updates matter.

What is the difference between batch and streaming dataflow?

Batch dataflow handles bounded sets of data with clear start and end times, whereas streaming dataflow processes unbounded, continuously growing datasets. Stream processing emphasizes windowing, event-time semantics, and incremental state updates; batch workflows focus on bulk operations, full recomputation, and scheduled runs.

systemsarchitecture-image-blog

Event Sourcing vs CQRS: Patterns for Modern Data Architecture

Event sourcing and CQRS are two patterns that often show up together in modern systems architecture conversations — like peanut butter and jelly, but for data. They solve different problems: event sourcing captures every state change as an immutable record, while CQRS separates how you write data from how you read it. In this article you’ll learn what each pattern does, when and how to combine them, the trade-offs to watch for, and practical tips for implementing them in real-world systems.

Why these patterns matter today

Modern applications demand scalability, traceability, and flexibility. Traditional CRUD models can become brittle when you need auditability, temporal queries, or independent optimization of read and write workloads. Event sourcing and CQRS address those concerns by changing how you think about state and queries:

  • Event sourcing records every change as an immutable event log, giving you a complete audit trail and the ability to rebuild state at any moment.
  • CQRS splits command (write) and query (read) responsibilities so you can optimize each side independently — faster reads, simpler write logic, or different storage technologies.

Major cloud providers and architecture guides recommend these patterns as building blocks for resilient, scalable systems — see Microsoft’s guidance on event sourcing and their separate guidance on CQRS for more technical background.

Core ideas: Event sourcing explained

Event sourcing replaces the typical “store the current state” approach with “store every state change as an event.” Instead of updating an account balance field, you append an event like AccountCredited or AccountDebited. The current state is then computed by replaying the events.

Benefits include:

  • Auditability: you have the full history of what happened and why.
  • Temporal queries and time travel: reconstruct state at any point in time.
  • Resilience for microservices: events are natural integration points between services.

Costs and trade-offs:

  • Increased complexity: event design, versioning, snapshots, and replay logic add engineering overhead.
  • Storage and operational concerns: event stores must be managed and scaled, and long event histories can require snapshots to speed up rehydration.

For practical guidance about combining event sourcing with CQRS and using event streams to power read models, AWS offers pragmatic advice in their prescriptive guidance on team-oriented service design and event-driven persistence patterns: AWS prescriptive guidance.

Core ideas: CQRS explained

CQRS (Command Query Responsibility Segregation) says: separate the models you use to modify state (commands) from the models you use to read state (queries). That separation lets you design each model for its specific purpose. For example, write model logic can focus on enforcing business rules while read models can be denormalized and optimized for fast queries.

Benefits include:

  • Performance: read stores can be tuned for low-latency queries without affecting write throughput.
  • Scalability: scale reads and writes independently to match demand.
  • Clarity: command handlers and query handlers remain simpler and more focused.

Limitations and implications:

  • Eventual consistency: reads may lag behind writes unless you engineer for synchronous update paths.
  • Operational complexity: maintaining multiple data stores and synchronization pipelines requires discipline.

Microsoft’s CQRS guidance explains how separation can simplify design and when combining CQRS with event sourcing is appropriate for auditability and flexible model evolution: CQRS guidance.

💡 Tip: Start with the problem, not the pattern. If you don’t need full audit logs, time-travel, or independent read scaling, CQRS or event sourcing might add unnecessary complexity. Use these patterns where their benefits clearly outweigh the cost.

How they work together: event sourcing + CQRS

Event sourcing and CQRS are often combined. The typical flow looks like this:

  1. Commands arrive at the write model which appends events to an event store (event sourcing).
  2. Event handlers create projections or materialized views optimized for queries (CQRS read model).
  3. Reads use the materialized views; writes use the event store and business logic.

This combination gives you a durable, auditable source of truth (the event log) and fast, tailored read models for different parts of your system. Practical patterns include using event streams to update in-memory databases for heavy-read endpoints and replaying events to recompute state after a model change, as recommended in cloud architecture guidance such as Microsoft’s event sourcing docs and AWS prescriptive patterns.

Projections, snapshots, and replays

Because replaying a long event stream for each request would be slow, systems use projections (materialized views) and snapshots:

  • Projections consume events and project current state into a read-optimized store (SQL, NoSQL, search index, in-memory cache).
  • Snapshots save a computed state periodically so rehydration needs only events since the last snapshot.
  • Replays let you rebuild projections after code changes or to handle schema evolution.

Microservices patterns documentation also recommends pairing event sourcing with CQRS into sagas or process managers when coordinating long-running transactions across services: Event sourcing patterns.

When to choose one, the other, or both

Practical rules of thumb:

  • Use plain CRUD if your data model is simple, audit needs are low, and you want to minimize complexity.
  • Use CQRS without event sourcing if you want separate read/write models but don’t need full event history (easier to adopt).
  • Use event sourcing if you need full audit trails, temporal queries, or strong traceability across business flows.
  • Use event sourcing + CQRS when you need the auditability of events plus read performance from optimized projections.

Choosing depends on product requirements, team expertise, and operations readiness. If you’re building systems that will power analytics or machine learning, designing a robust event pipeline can feed downstream models and help with reproducible training data — read more about how data engineering supports AI in our overview of Data Engineering for AI – it explains why well-structured data foundations help AI projects succeed.

Read more: Data Engineering Services – how tailored data infrastructure helps implement event-driven architectures cleanly.

Operational considerations and pitfalls

Adopting these patterns affects your entire stack — not just the application code. Consider:

  • Event store selection: durability, ordering guarantees, retention policies, and tooling. Kafka, EventStoreDB, and cloud-native event stores each behave differently.
  • Schema evolution: events are immutable, so versioning of event formats and backward/forward compatibility strategies are essential.
  • Monitoring and observability: you must track event processing, projection lag, and failed consumers.
  • Recovery and replay: plan for replays to update projections and test them regularly to avoid surprises.
  • Consistency models: communicating eventual consistency to product and UX teams is critical to avoid surprises for users.

Cloud and infrastructure teams also need to design infrastructure-as-code, backups, and cost controls for event storage — topics we go into in our Infrastructure as Code writeup, which highlights automation and governance strategies for operational reliability.

Read more: Cloud Cost Optimization – practical strategies to keep event-driven platforms cost-effective as they scale.

Patterns and anti-patterns

Helpful patterns:

  • Design for idempotency: event handlers should handle duplicate events safely.
  • Use time-based snapshots to speed up rehydration.
  • Keep read models denormalized and purpose-built for queries.
  • Adopt a robust event versioning strategy and backward-compatible consumers.

Common anti-patterns:

  • Treating events as mere change logs without modeling intent — events should represent business facts.
  • Using event sourcing to “replace” a relational design without clear benefits.
  • Failing to instrument and monitor projection lag, leading to unexpected stale reads.

Trends and ecosystem

As organizations move toward event-driven microservices and real-time analytics, the ecosystem around event sourcing and CQRS is growing. Cloud providers publish prescriptive guidance for combining these patterns at scale — for example, Microsoft’s architecture center gives practical steps for modeling and materializing views from events, and AWS prescriptive guidance covers team-level service design with event streams and sagas. For approachable explanations and practical patterns, see the Mia-Platform overview on understanding event sourcing and CQRS: Understanding Event Sourcing and CQRS.

Practical starter checklist

  • Define the business reasons: audits, time travel, scaling reads, or cross-service integration?
  • Start small: implement CQRS first for a high-read endpoint, then consider event sourcing if audit/history becomes required.
  • Pick an event store and projection technology that your team can operate reliably.
  • Design event schemas thoughtfully and version them from day one.
  • Invest in monitoring, replay tests, and documentation for event handlers and projections.
Read more: AI Development Services – why consistent, auditable data pipelines matter when you build AI solutions that rely on event-driven histories.

FAQ

What is modern data architecture?

Modern data architecture is an approach that emphasizes scalable, flexible, and often event-driven designs to support analytics, operational applications, and integrations. It typically includes data pipelines, event streams, materialized views, and cloud-native storage to enable real-time insights and reproducible data processing.

What is the difference between data architecture and data management?

Data architecture is the blueprint — the models, storage choices, flows, and integrations that determine how data moves and is stored. Data management is the operational discipline that enforces quality, governance, security, and lifecycle policies across that architecture.

How to create a data architecture?

Start by mapping business requirements: what data is needed, who consumes it, and how fresh it must be. Choose storage and processing patterns (batch, stream, event-driven), define schemas and contracts, and then implement pipelines, monitoring, and governance. Iterate with stakeholders and build reusable components.

What is a data architecture framework?

A data architecture framework is a structured approach or set of guidelines for designing and implementing data systems. It includes standards for data modeling, storage choices, integration patterns, governance, and security. Frameworks help teams make consistent, repeatable decisions.

What are the two main components of data architecture?

At a high level, the two main components are the data storage/processing layer (where data is persisted and transformed) and the data access/integration layer (how applications and analytics systems read and consume that data). Event-driven systems add an event bus or event store as a core component as well.

datacomparison2-image-blog

Kafka Connect vs Airbyte vs Fivetran: Data Integration Tool Comparison

In the world of modern data engineering, moving data reliably and efficiently is like keeping coffee flowing in an office critical, often taken for granted, and deeply missed when it fails. Kafka Connect, Airbyte, and Fivetran are three popular approaches to data integration, each with different philosophies, strengths, and trade-offs. In this article we’ll demystify how they compare across architecture, extensibility, cost, and operational complexity so you can pick the right tool for your team’s needs.

Why this comparison matters

Data integration sits at the center of analytics, AI, and operational systems. Pick the wrong tool and you wrestle with fragile connectors, hidden costs, or stale data pipelines. Choose well and you gain flexible, low-maintenance flows that power reliable insights and products. This guide will help you understand: what each tool is optimized for, real-world pros and cons, and a practical checklist to make a decision that scales with your business.

💡 Tip: Start with your highest-value data flows—those that impact customers or revenue—and evaluate tools against those specific use cases instead of trying to pick a universal winner.

At a glance: what each tool is

Kafka Connect

Kafka Connect is part of the Apache Kafka ecosystem and is designed for high-throughput, low-latency streaming integrations. It treats connectors as pluggable components for ingesting into or exporting from Kafka topics. Kafka Connect shines when you want continuous streaming, complex event-driven architectures, and tight integration with Kafka’s ecosystem (stream processing, schema registry, etc.). Expect to manage more infrastructure and configuration, but gain maximum control and performance.

Airbyte

Airbyte is an open-source ELT (Extract, Load, Transform) platform that emphasizes connector parity and rapid development. It offers a growing catalog of connectors and a framework that encourages users to build or customize connectors easily. Airbyte supports both self-hosted and cloud-managed deployments. It’s a good fit for teams that want straightforward ELT pipelines with the option to extend connectors or run custom transformations.

Fivetran

Fivetran is a managed data integration service that focuses on zero-maintenance connectors. It handles schema changes automatically and provides a broad library of pre-built connectors to data sources and destinations. Fivetran is designed for teams that prioritize rapid time-to-insight and minimal operational overhead—at a price. It’s especially appealing when you want predictable, hands-off data movement without building or maintaining connectors yourself.

Read more: Data Engineering Insights – useful background on why reliable pipelines are essential for AI and analytics.

Key comparison criteria

  • Connectivity & coverage: How many sources and destinations are supported out-of-the-box?
  • Extensibility: How easy is it to create or customize connectors?
  • Operational model: Managed service vs self-hosted control and maintenance.
  • Data transformation: Where and how transformations run (in-source, in-destination, or in-pipeline).
  • Latency & throughput: Batch vs streaming capabilities and performance limits.
  • Cost and licensing: Pricing predictability and total cost of ownership.
  • Reliability & schema handling: How robust are connectors to schema drift and errors?

Connectivity & coverage

Fivetran tends to lead on out-of-the-box connector breadth and maturity for business systems (SaaS apps, databases, ad platforms). Airbyte’s community and open-source model make it quickly extensible—if a connector doesn’t exist, you or the community can build one. Kafka Connect is often used for systems that already stream through Kafka or need custom, high-performance connectors; its ecosystem includes many connectors, but you may write custom ones more frequently.

Extensibility and developer experience

Airbyte offers a connector development kit that lowers the barrier for building custom connectors. Kafka Connect requires Java-based connector development or leveraging existing connector frameworks, and while powerful, it can be more developer-heavy. Fivetran, being managed, limits how much you can customize connectors—what you gain in convenience you lose in deep customizability.

💡 Tip: If you need a connector that talks to an internal API or uses a special auth flow, Airbyte or Kafka Connect gives more flexibility than Fivetran.

Transformations: ELT vs streaming transforms

Fivetran leans into ELT: extract and load first, then transform in the warehouse (dbt is a popular partner pattern). Airbyte supports ELT and can run transformations after load, either via embedded transformation features or by integrating with transformation tools. Kafka Connect is built for streaming; transformations are typically done with stream processing tools (Kafka Streams, ksqlDB, other consumers) or single-message transforms (SMTs) inside the connector.

Operational model and maintenance

Fivetran’s managed approach removes most operational burden—updates, scaling, and schema change handling are part of the service. Airbyte offers both self-hosted and hosted options, so you trade management effort for cost control and flexibility. Kafka Connect is typically self-hosted (though some cloud providers offer managed Kafka); you’ll manage cluster health, scaling, and connector lifecycle. The more control you want, the more operational responsibilities you accept.

Read more: Data Engineering Services – if you’re thinking about outsourcing parts of pipeline build and maintenance, this explains our approach.

Latency, throughput, and reliability

For high-throughput, low-latency streaming, Kafka Connect is often the go-to due to Kafka’s design. Airbyte can handle near-real-time jobs with incremental replication, but is generally oriented toward periodic ELT workloads. Fivetran focuses on reliable, possibly near-real-time syncs depending on connector, with strong guarantees around schema handling and retries. Consider your SLA for data freshness and peak data rates when choosing.

Security & compliance

Fivetran provides enterprise-grade security and compliance features out of the box, including SOC and ISO certifications in many cases, reducing compliance lift for customers. With self-hosted Airbyte or Kafka Connect, security is in your hands—great for environments with strict data protection requirements, but it requires strong operational discipline (networking, secrets management, logging, and monitoring).

💡 Tip: If you handle regulated data (PHI, PCI), weigh whether you prefer a managed vendor’s compliance certifications or a self-hosted stack where you control every lock and key.

Use-case driven recommendations

  • Streaming event-driven systems (high throughput): Kafka Connect is usually best—tight Kafka integration and low-latency guarantees.
  • Rapid ELT with lots of SaaS connectors and minimal ops: Fivetran for fast setup and low maintenance.
  • Flexible, open-source, extensible pipelines with cost control: Airbyte for teams that want the middle ground—connector parity, ability to customize, and both self-hosted and cloud options.
  • Hybrid needs (streaming + batch): Combine technologies—Kafka for real-time streams, and Airbyte/Fivetran for batch ELT into the warehouse.
Read more: Custom Data Engineering – for building pipelines that combine the right tools to meet business goals.

Cost considerations

Fivetran is subscription-based and often priced by rows/volume and connector type; it provides predictability but can be costly at scale. Airbyte’s self-hosted model can be more cost-effective but transfers operational costs (hosting, maintenance) to you. Kafka Connect cost is driven by Kafka infrastructure, storage, and operations. When estimating TCO, include engineering time, hosting, monitoring, and incident response, not just vendor fees.

Migration and coexistence strategy

You don’t always have to pick one tool forever. Many organizations use multiple systems: Kafka for streaming events, Airbyte for custom ELT jobs, and Fivetran for key SaaS sources where delegation is valuable. If you’re migrating from one to another, plan connector parity, data reconciliation, backfills, and a cutover window. Start small, validate data correctness, and iterate.

💡 Tip: Run the new pipeline in parallel with the old one for a week or two, compare outputs row-for-row on representative datasets, and automate those checks.

Common challenges and how to handle them

Schema drift

Sources change—columns are added, types evolve. Fivetran often masks this with automated schema evolution detection. With Airbyte and Kafka Connect, you’ll need processes and tooling (schema registries, automated tests) to detect and reconcile changes.

Data duplication and idempotency

Especially when replays, outages, or retries occur, ensuring idempotent loading is crucial. Kafka’s at-least-once semantics need consumer-side deduplication strategies. ELT flows need stable keys and change-detection mechanisms to avoid duplicates.

Monitoring and alerting

Operational visibility is non-negotiable. Use metrics, logs, and end-to-end data quality checks. Managed services may offer built-in dashboards; self-hosted stacks require integrating observability tools and alerts.

Trends to watch

  • Growing use of hybrid architectures that combine streaming and ELT.
  • Increased adoption of open-source connectors and community-driven catalogs.
  • More out-of-the-box data quality and observability features across platforms.
  • Tool consolidation—teams prefer fewer systems that cover more use cases without sacrificing control.
Read more: Cloud Infrastructure Services – helpful when you’re deciding between managed and self-hosted deployments and want to design a scalable environment.

Decision checklist: which to choose?

  1. Define data freshness SLAs: real-time, near-real-time, or batch?
  2. Catalog your sources: SaaS apps, databases, event streams, custom APIs?
  3. Decide who will operate the stack: internal ops team or managed vendor?
  4. Assess connector customization needs and future growth.
  5. Estimate total cost of ownership including engineering time.
  6. Prototype a representative pipeline and validate data correctness and performance.
💡 Tip: Prototype with a single high-priority pipeline for two weeks—measure data latency, error rate, and maintenance time—and use that as the basis for scaling decisions.

FAQ

What is data integration in simple words?

Data integration is the process of combining data from different sources into a single, unified view so it can be analyzed or used by applications. Think of it as plumbing that moves and aligns data—cleaning, transforming, and loading it where it’s useful.

Which tool is used for data integration?

There are many tools. Kafka Connect is a streaming-focused integration layer for Kafka; Airbyte is an open-source ELT platform emphasizing extensible connectors; and Fivetran is a managed service offering ready-made connectors and minimal operational overhead. The “right” tool depends on your data types, latency needs, and operational preferences.

What are the types of data integration?

Common types include batch integration (periodic loading), real-time/streaming integration (continuous event streams), and hybrid approaches that mix batch and streaming. Integration can also be categorized by method—ETL (extract, transform, load) or ELT (extract, load, transform).

Is data integration the same as ETL?

Not exactly. ETL is a specific pattern within data integration where data is extracted, transformed, then loaded into a target system. Data integration is a broader term that includes ETL, ELT, streaming approaches, and other methods of moving and merging data across systems.

What are the three main issues faced in data integration?

The three most common pain points are schema drift (source changes breaking downstream flows), data quality/inconsistencies (missing or malformed records), and operational overhead (monitoring, scaling, and fixing pipelines). Address these with automated schema handling, rigorous data validation, and strong observability practices.

Read more: AI Development Services – if you’re moving data to power AI, learn how robust pipelines become the foundation for reliable models.

Choosing between Kafka Connect, Airbyte, and Fivetran is less about picking the single best tool and more about matching each tool’s strengths to your organization’s needs. If you want control and streaming performance, Kafka Connect is compelling. If you value extensibility and open-source flexibility, Airbyte is attractive. If you want fast time-to-value and minimal ops, Fivetran is hard to beat. Mix and match where appropriate, prototype early, and measure everything because good data engineering is practical, measurable, and yes, a little heroic.

Read more: Custom Software Solutions – when pipelines need bespoke logic or integrations, tailored development helps make them production-ready.
datalife-image-blog

What Data Lineage Is (and Why It’s Critical for Data Governance)

Data lineage maps the life story of your data — where it came from, what happened to it, and where it ended up. In a world where business decisions, compliance audits, and machine learning models all rely on reliable data, lineage is the GPS and black box recorder rolled into one. This article explains what data lineage is, why it matters for governance, how to build it in practice, common challenges, and practical tips you can use today.

Why data lineage matters

Imagine an analyst finds a surprising drop in monthly revenue. Without lineage, tracing that number back to the source is like untangling a ball of holiday lights — frustrating and time-consuming. Data lineage provides the visibility to answer questions such as: Which source system contributed the value? Which transformations changed it? Which report uses that dataset? That traceability builds trust in analytics, speeds debugging, and helps meet regulatory requirements.

Governance programs depend on lineage because it ties policy to reality. Lineage shows where sensitive fields flow, who touches them, and where controls must be applied. For a concise overview of how lineage supports governance principles and compliance, see Dataversity’s guide to What Is Data Lineage?

💡 Tip: Start with the business-critical data domains (finance, customer, product). If you can map lineage for high-impact reports and pipelines first, you’ll quickly prove value and get buy-in for broader lineage efforts.

Core concepts and types of lineage

At its simplest, data lineage documents:

  • Sources — where the data originates (databases, APIs, files).
  • Transformations — what happened to the data (joins, filters, aggregations, ML feature engineering).
  • Targets — where the data lands (reports, dashboards, data warehouses, downstream systems).
  • Actors and processes — jobs, pipelines, and users that moved or modified the data.

There are a few ways to categorize lineage:

  • Physical lineage — concrete movement of files and tables through systems (what actually ran).
  • Logical lineage — higher-level relationships between fields and datasets (business view of flow).
  • Manual vs. automated lineage — manual documentation is helpful but brittle; automated lineage capture (via metadata, code parsing, or instrumentation) scales better.

For more on the different types and practical approaches, Informatica offers a helpful primer in their data lineage guide.

How lineage supports data governance

Lineage is the connective tissue that makes governance actionable. Here’s how it plays into common governance objectives:

  • Compliance and audit readiness: Auditors want to know the origin of reported numbers and whether controls were applied. Lineage creates an auditable trail.
  • Data quality and issue resolution: When quality problems appear, lineage helps isolate the responsible pipeline or transformation so teams can fix the root cause rather than patching symptoms.
  • Security and privacy: Knowing how sensitive attributes flow across systems enables targeted masking, encryption, or access controls.
  • Trust and collaboration: Business stakeholders are likelier to trust analytics when they can inspect how values were derived.

Research shows lineage increases transparency and trust while enabling teams to align handling practices with governance principles — see the university study “Tracing the Path” for an academic perspective on lineage’s governance impact: Tracing the Path: Data Lineage and Its Impact on Data Governance.

Read more: Data Engineering for AI – strong lineage relies on the same foundational practices that make AI systems reliable.

How to build data lineage — practical steps

Building lineage can feel intimidating, but a pragmatic approach reduces friction. Consider this phased strategy:

  1. Inventory and prioritize: Catalog critical datasets and reports. Focus on business-impact areas first (finance, compliance, customer metrics).
  2. Choose the right mix of capture methods: Use automated capture where possible (metadata extraction, ETL/ELT integration, code parsing). Supplement with manual entries for data flowing through non-instrumented systems.
  3. Adopt consistent metadata standards: Agree on naming, field definitions, and transformation documentation so lineage maps stay useful across teams.
  4. Integrate with a data catalog: Lineage paired with a catalog gives context — owners, SLA, sensitivity tags, and business glossaries — so governance actions are informed.
  5. Automate monitoring and alerts: Flag topology changes, unexpected schema drift, or failed pipelines so triage starts early.
  6. Embed into workflows: Make lineage part of release reviews, model validation, and incident postmortems so it’s a living asset, not a dusty diagram.

Platforms and vendor literature emphasize metadata-driven lineage and embedding lineage in catalogs to support governance and issue identification; Dataversity covers these strategies well in their overview What Is Data Lineage?.

💡 Tip: If your stack includes managed ETL/ELT tools or cloud data warehouses, enable built-in lineage hooks first — they often provide high-value lineage with minimal setup.
Read more: Data Engineering Services – useful if you need pipelines and metadata practices that make lineage feasible and scalable.

Common challenges and how to overcome them

Lineage implementations can stumble for practical reasons. Here are frequent pain points and simple remedies:

  • Fragmented toolchains: Multiple ETL tools, cloud providers, and legacy databases make lineage capture uneven. Remedy: prioritize connectors for high-value systems and use open lineage standards when possible.
  • Manual processes and shadow pipelines: Business users running spreadsheets or ad hoc scripts create blind spots. Remedy: focus on education and lightweight policies that encourage registering ad hoc flows in the catalog.
  • Ambiguous ownership: Without clear data owners, lineage maintenance lags. Remedy: assign dataset owners with responsibilities for lineage accuracy and periodic reviews.
  • Noise and irrelevant detail: Too much low-level lineage can overwhelm users. Remedy: provide both high-level logical views for business users and detailed physical traces for engineers.

Automating lineage helps reduce human error and maintenance overhead. Secoda’s blog describes how automated lineage improves governance and trust in analytic outputs: What is the role of data lineage in data governance?.

Read more: Data Engineering Solutions – tailored practices that reduce lineage friction and improve long-term maintainability.

Trends, tools, and where to invest

Lineage tooling has matured quickly. Look for solutions that:

  • Support automated capture across ETL/ELT, streaming, and BI tools.
  • Implement open lineage standards for portability and integration.
  • Include both physical and logical lineage views for different user personas.
  • Integrate with catalogs, access control, and data quality tooling for end-to-end governance.

Vendors and consultancies consistently highlight how lineage enables audit readiness, change management, and operational efficiency — for more on the specific governance benefits, Alation’s piece on lineage benefits is practical and business-minded: Understanding Data Lineage: Benefits and Integration.

💡 Tip: Treat lineage as cross-functional. Make sure data engineers, compliance officers, analysts, and product owners all have input into how lineage is represented and consumed.
Read more: Cloud Cost Optimization – knowing data flows helps cut costs by revealing duplication and unnecessary storage paths.

FAQ

What is the meaning of data lineage?

Data lineage documents and visualizes the lifecycle of data: its sources, transformations, systems, and destinations, creating a traceable history.

Why is data lineage important?

Lineage builds accountability, supports compliance, improves data quality, and increases trust in analytics by making every transformation traceable.

What are the different types of data lineage?

Types include physical lineage (actual flows), logical lineage (conceptual relationships), and manual vs. automated lineage capture.

How to build a data lineage?

Start by cataloging critical datasets, use automated capture, define consistent metadata standards, integrate with a catalog, and automate monitoring.

What is the difference between data lineage and data provenance?

Provenance focuses on data origin and ownership (authenticity), while lineage maps the full journey including transformations and flows across systems.

Final thoughts

Data lineage isn’t a nice-to-have ornament for your data warehouse — it’s a practical necessity for trustworthy analytics, governance, and efficient operations. Start small, automate what you can, and make lineage accessible to both engineers and business users. With lineage in place, audits become less terrifying, debugging becomes quicker, and your organization gains a clearer view of the data that powers decisions. If you want help building lineage-friendly pipelines and metadata practices, connecting those engineering choices to governance is what we do best.

datacomparison-image-blog

Delta Lake vs Apache Iceberg vs Apache Hudi: Open Table Format Showdown

Open table formats Delta Lake, Apache Iceberg, and Apache Hudi the plumbing of modern data architectures. They turn chaotic object storage into queryable, transactional tables that teams can actually trust. In this article you’ll get a practical, no-nonsense comparison of the three, learn when to pick one over the others, and see how operational strategies like compaction, metadata design, and concurrency control change real-world performance.

Why open table formats matter (and why your CFO should care)

Data lakes without structure can become data swamps: lots of bytes, little reliability. Open table formats add a metadata layer and transactional guarantees think ACID on top of object storage so downstream analytics, ML models, and business reports don’t break when someone backfills a partition or updates a record. The benefit is both technical (faster, more efficient queries; time travel for debugging) and financial (less wasted compute, fewer emergency engineering dives at 2 am).

Different formats adopt different philosophies: Delta Lake started within the Databricks ecosystem, Iceberg emphasizes a snapshot-based, engine-agnostic approach, and Hudi focuses on ingestion latency and update patterns. For a clear architectural overview, Dremio’s breakdown is a helpful primer on how each format organizes metadata and snapshots: Dremio architecture.

Read more: Data Engineering AI – learn why structured, reliable data is essential for AI systems and how data engineering supports that reliability.

Core concepts: table format vs file format

First, a short clarification often missed at meetings: a file format (Parquet, ORC, Avro) defines how rows and columns are encoded on disk. A table format (Delta, Iceberg, Hudi) defines how files are tracked, how transactions are coordinated, and how schema evolution and time travel are handled. Put simply: file formats store bytes; table formats manage the bytes and the story of those bytes over time.

Delta Lake’s blog gives a helpful explanation of how open table formats provide ACID transactions, time travel, and metadata handling that elevate raw files into trustworthy tables: Delta open table formats.

Feature-by-feature comparison

ACID transactions and metadata

All three support ACID semantics, but the implementations differ. Delta Lake uses a transaction log (a sequence of JSON/Parquet checkpoint files) and strong metadata guarantees; Iceberg uses a manifest and snapshot model that separates table metadata from files; Hudi maintains its own metadata and can operate in two table types Copy On Write (COW) and Merge On Read (MOR) which change how updates and reads interact.

Snapshotting, time travel, and reads

Iceberg’s snapshot-based design makes time travel and consistent reads across engines pretty straightforward. Delta also offers time travel and a robust log-based approach. Hudi’s MOR gives a hybrid option: fast writes with later compaction to optimize reads, which is great when ingestion latency and update frequency are high.

Read more: Data Engineering Services – if you’re building pipelines that rely on reliable table formats, this explains how to design pipelines and governance around them.

Concurrency and transactional models

Concurrency control matters when many jobs write to the same table. Iceberg emphasizes optimistic concurrency and snapshot isolation; Delta Lake’s log-based approach offers a strong transactional model across many engines (especially with Spark); Hudi uses locking and timeline services suitable for high-ingest patterns.

For a direct comparison of transactional handling and ingestion strategies, the LakeFS comparison is practical: Hudi vs Iceberg vs Delta comparison.

Updates, deletes, and CDC

If your use case requires frequent updates, deletes, or change-data-capture (CDC) downstream, Hudi and Delta historically have been strong because they emphasize record-level mutations and ingestion semantics. Iceberg has been catching up fast with features that make update/delete and partition evolution smoother while maintaining an engine-agnostic posture.

Compaction, small files, and performance

Small files kill read performance and increase metadata churn. Each format has strategies: Delta provides a Compaction API and Z-Order clustering options; Hudi supports compaction for MOR tables and other tuning knobs; Iceberg suggests effective partition specs and file sizing practices. AWS provides a practical guide to compaction and optimization techniques across formats when running on cloud object stores: AWS guide to choosing a table format.

💡 Tip: When you see a table full of tiny Parquet files, don’t panic — plan a rolling compaction job. Use clustering or partition rewrites during low-traffic windows and target file sizes that match your compute engine’s sweet spot (usually tens to hundreds of MB).

Operational considerations and trade-offs

Picking a format is as much about operations as it is about features. Consider the following operational trade-offs:

  • Engine compatibility: Iceberg was designed to be engine-agnostic and works well across engines (Spark, Flink, Trino). Delta is tightly integrated into Databricks and Spark but has grown wider through the Delta Open Source initiative. Hudi focuses on ingestion patterns and integrates well with streaming ecosystems.
  • Operational maturity: Are your engineers already familiar with Spark-based optimizations? Delta and Hudi may be a smoother fit. If you expect to query from many engines, Iceberg’s snapshot model is compelling.
  • Ingestion patterns: If you need low-latency upserts from streaming sources, Hudi’s MOR and write-optimized patterns are beneficial. If you mostly append data and prefer a clear snapshot lifecycle, Iceberg might be simpler to operate.
Read more: Tailored AI Solutions – choosing a table format is just one part of a larger data strategy for AI and analytics; this piece shows how to align technical choices with business goals.

Costs and cloud considerations

File metadata operations and compaction jobs cost compute and sometimes drive storage metadata growth. Your cloud bill will reflect the choices you make: frequent small writes and inefficient file layouts increase both compute and egress costs. Plan compaction strategies, lifecycle policies, and monitoring to avoid surprises. For cost-related strategy tied to cloud operations, our cloud cost optimization guidance can be a big help.

Read more: Cloud Cost Strategies – practical steps to keep cloud spending aligned with your business impact.

Trends and where each project is heading

Open table formats are converging feature sets: Iceberg, Hudi, and Delta are borrowing good ideas from each other—better handling for updates, richer metadata services, and improved cross-engine compatibility. Expect faster innovation around metadata scaling, snapshot compaction, and cloud-native integrations. For a snapshot of architectural differences and evolving capabilities, Dremio’s analysis remains useful: Dremio architecture.

Choosing the right format for real-world use cases

High-level guidance to match format to need:

  1. Engine diversity and multi-tool querying: Choose Iceberg for broad engine compatibility and snapshot semantics.
  2. Frequent updates, upserts, and streaming ingestion: Choose Hudi for ingestion patterns that require low-latency record-level updates and flexible compaction strategies.
  3. Spark-native analytics and integrated tooling (and a tight Databricks fit): Choose Delta Lake for mature Spark integration, strong transaction logging, and features like Z-Order clustering.

In many enterprises, the right answer might be “it depends”—and sometimes teams run more than one format in the same ecosystem depending on workload types. The AWS comparison article gives actionable tips when selecting formats on cloud storage: AWS blog.

FAQ

What is meant by data governance?

Data governance is the set of processes, policies, roles, standards, and metrics that ensure effective and efficient use of data. In a data mesh, these responsibilities are federated across domains rather than centralized in one team.

What is the difference between data governance and data management?

Data management is the day-to-day operation of moving, storing, and processing data. Data governance defines the rules, roles, and policies that guide how data is managed and ensures it meets organizational requirements.

What are good data governance practices?

Best practices include clear ownership, standardized metadata, automated enforcement of policies, monitoring governance KPIs, and starting with a minimal viable governance approach that grows with domain maturity.

What are the three components of data governance?

Data governance typically consists of people (roles and responsibilities), processes (policies and workflows), and technology (tools and automation). In a mesh, these components are distributed and coordinated via a federated council.

What is a data governance framework?

A data governance framework defines the policies, standards, roles, and tools for managing and protecting data. In a data mesh, the framework emphasizes federation, metadata standards, and automation for scalable governance.

Final thoughts (the short version for the meeting with the execs)

If you need broad query engine compatibility and clear snapshot semantics, look at Iceberg. If you need record-level upserts, fast streaming ingestion, and flexible compaction, Hudi is compelling. If your stack is Spark-first and you value strong transaction logging and Databricks-synced features, Delta Lake is an excellent choice. Whatever you pick, add operational guardrails: compaction strategies, monitoring for small files, and clear schema evolution policies.

And remember: the format is a tool, not a destination. Align the choice with team skills, expected workloads, and long-term interoperability goals. If you want help mapping your use case to an implementation plan, our data engineering and AI teams can help build a practical roadmap and implementation strategy that keeps both engineers and finance people happy.

Read more: AI Development Services – how data choices feed into trustworthy AI and analytical systems.